
Online Performance Analysis and Visualization of Large-Scale Parallel Applications - PowerPoint PPT Presentation
1 / 1
Title:
Online Performance Analysis and Visualization of Large-Scale Parallel Applications
Description:
Parallel performance tools offer the program developer insights into the ... to control and adapt long-running applications based on performance feedback. ... – PowerPoint PPT presentation
Number of Views:117
Avg rating:3.0/5.0
Title: Online Performance Analysis and Visualization of Large-Scale Parallel Applications
1
Online Performance Analysis and Visualization of
Large-Scale Parallel Applications Kai Li, Allen
D. Malony, Sameer Shende, Robert Bell Performance
Research Laboratory, University of Oregon
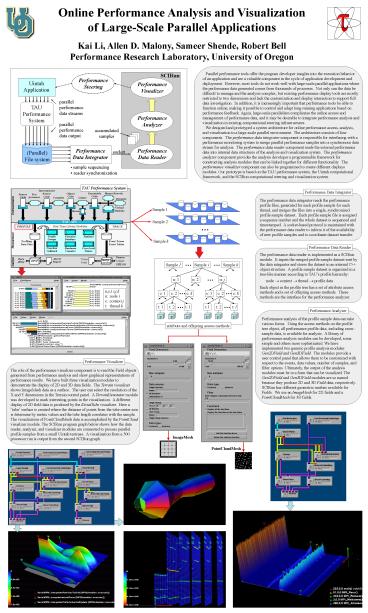
Parallel performance tools offer the program
developer insights into the execution behaviorof
an application and are a valuable component in
the cycle of application development and
deployment. However, most tools do not work well
with large-scale parallel applications where the
performance data generated comes from thousands
of processes. Not only can the data be difficult
to manage and the analysis complex, but existing
performance display tools are mostly restricted
to two dimensions and lack the customization and
display interaction to support full data
investigation. In addition, it is increasingly
important that performance tools be able to
function online, making it possible to control
and adapt long-running applications based on
performance feedback. Again, large-scale
parallelism complicates the online access and
management of performance data, and it may be
desirable to integrate performance analysis and
visualization in existing computational steering
infrastructures. We designed and prototyped a
system architecture for online performance
access, analysis, and visualization in a
large-scale parallel environment. The
architecture consists of four components. The
performance data integrator component is
responsible for interfacing with a performance
monitoring system to merge parallel performance
samples into a synchronous data stream for
analysis. The performance data reader component
reads the external performance data into internal
data structures of the analysis and visualization
system. The performance analyzer component
provides the analysis developer a programmable
framework for constructing analysis modules that
can be linked together for different
functionality. The performance visualizer
component can also be programmed to create
different displays modules. Our prototype is
based on the TAU performance system, the Uintah
computational framework, and the SCIRun
computational steering and visualization system.
TAU Performance System
Performance Data Integrator
The performance data integrator reads the
performance profile files, generated for each
profile sample for each thread, and merges the
files into a single, synchronized profile sample
dataset. Each profile sample file is assigned a
sequence number and the whole dataset is
sequenced and timestamped. A socket-based
protocol is maintained with the performance data
reader to inform it of the availability of new
profile samples and to coordinate dataset
transfer.
Performance Data Reader
The performance data reader is implemented as a
SCIRun module. It inputs the merged profile
sample dataset sent by the data integrator and
stores the dataset in an internal C object
structure. A profile sample dataset is organized
in a tree-like manner according to TAUs profile
hierarchy node ? context ? thread ? profile
dataEach object in the profile tree has a set
of attribute access methods and a set of
offspring access methods. These methods are the
interface for the performance analyzer.
Sample i
Sample 1
Sample k
n 1
n 2
n j
n,c,t i,j,kn node ic context jt thread k
t 1
t 2
t l
t 1
t 2
t l
Performance Analyzer
Performance analysis of the profile sample data
can take various forms. Using the access methods
on the profile tree object, all performance
profile data, including cross-sample data, is
available for analysis. A library of performance
analysis modules can be developed, some simple
and others more sophisticated. We have
implemented two generic profile analysis modules
Gen2DField and Gen3DField. The modules provide a
user control panel that allows them to be
customized with respect to the events, data
values, number of samples, and filter options.
Ultimately, the output of the analysis modules
must be in a form that can be visualized. The
Gen2DField and Gen3DField modules are so named
because they produce 2D and 3D Field data,
respectively. SCIRun has different geometric
meshes available for Fields. We use an ImageMesh
for 2D fields and a PointCloudMesh for 3D fields.
attribute and offspring access methods
Performance Visualizer
The role of the performance visualizer component
is to read the Field objects generated from
performance analysis and show graphical
representations of performance results. We have
built three visualization modules to demonstrate
the display of 2D and 3D data fields. The
Terrain visualizer shows ImageMesh data as a
surface. The user can select the resolution of
the X and Y dimensions in the Terrain control
panel. A TerrainDenotator module was developed
to mark interesting points in the visualization.
A different display of 2D field data is produced
by the KiviatTube visualizer. Here a tube
surface is created where the distance of points
from the tube center axis is determine by metric
values and the tube length correlates with the
sample. The visualization of PointCloudMesh data
is accomplished by the PointCloud visualizer
module. The SCIRun program graph below shows how
the data reader, analyzer, and visualizer modules
are connected to process parallel profile samples
from a small Uintah testcase. A visualization
from a 500 processor run is output from the
second SCIRun graph.
ImageMesh
PointCloudMesh
Recommended
CrystalGraphics Presentations


