
Introduction to Cartographic Mapping - PowerPoint PPT Presentation
1 / 22
Title:
Introduction to Cartographic Mapping
Description:
The line of zero latitude is called the equator. X-values ranging between -180 to 180 ... Universal Transverse Mercator (UTM) System. State Plane Coordinate System ... – PowerPoint PPT presentation
Number of Views:61
Avg rating:3.0/5.0
Title: Introduction to Cartographic Mapping
1
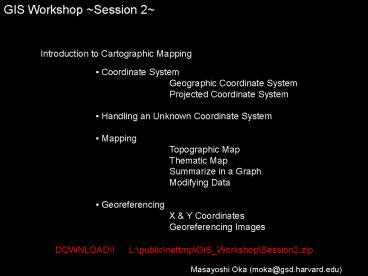
GIS Workshop Session 2
Introduction to Cartographic Mapping
- Coordinate System
- Geographic Coordinate System
- Projected Coordinate System
- Handling an Unknown Coordinate System
- Mapping
- Topographic Map
- Thematic Map
- Summarize in a Graph
- Modifying Data
- Georeferencing
- X Y Coordinates
- Georeferencing Images
DOWNLOAD!! L\public\nettmp\GIS_Workshop\Session2.
zip
Masayoshi Oka (moka_at_gsd.harvard.edu)
2
(No Transcript)
3
Coordinate System
The line of zero latitude is called the
equator. X-values ranging between -180 to
180 The line of zero longitude is called the
prime meridian. Y-values ranging between -90 to
90 The longitude that passes through Greenwich,
England The origin of coordinate system (0, 0)
is defined by where the equator and prime
meridian intersect.
Source http//webhelp.esri.com/arcgisdesktop/9.2/
index.cfm?TopicNamewelcome
4
Coordinate System
A reference system used to represent the
locations of geographic features, imagery, and
observations, such as GPS locations, within a
common geographic framework. Geographic
Coordinate System Uses a three-dimensional
spherical surface to define locations on the
earth. This includes an angular unit of measure,
a prime meridian, and a datum (based on a
spheroid). For example Latitude and
Longitude Projected Coordinate System Defined
on a flat, two-dimensional surface. It has
constant lengths, angles, and areas across the
two dimensions. It is always based on a
geographic coordinate system that is based on a
sphere or spheroid. Sometimes referred to as Map
Projection
Source http//webhelp.esri.com/arcgisdesktop/9.2/
index.cfm?TopicNamewelcome
5
Coordinate System
Projection Systems The area of least distortion
occurs where the figurative projection plane
touches the model of the earth. The method of
projection depends upon the area size and
location on earth.
Common Methods Universal Transverse Mercator
(UTM) System State Plane Coordinate System
Source http//www.gsd.harvard.edu/gis/manual/proj
ections/fundamentals/index.htm
6
Projection Systems
Universal Transverse Mercator (UTM) System
http//www.dmap.co.uk/utmworld.htm
State Plane Coordinate System
http//www.gsd.harvard.edu/gis/manual/projections/
fundamentals/zones.jpg
7
Handling an Unknown Coordinate System
1 Start ArcMap, with a new, empty map. 2 Add
the data with the unknown coordinate system. It
must not have a .prj file
Source http//webhelp.esri.com/arcgisdesktop/9.2/
index.cfm?TopicNamewelcome
8
Handling an Unknown Coordinate System
3 Right-click on the layer name and click the
Properties. 4 In the Layer Properties, click
the Source tab. 5 Observe the numerical values
in the Extent box.
Decimal degrees (Lat -90 and 90 Long -180 and
180) Geographic Coordinate System NAD 1927 or
NAD 1983
6, 7, or 8 digit numbers Projected Coordinate
Systems State Plane or UTM coordinate systems
Source http//webhelp.esri.com/arcgisdesktop/9.2/
index.cfm?TopicNamewelcome
9
Handling an Unknown Coordinate System
6 Locate Define Projection tool in the
ArcToolbox. 7 Select the layer whose projection
is to be defined. 8 Define projection by either
Select or Import option.
10
Handling an Unknown Coordinate System
9 Select an appropriate coordinate system from
a Geographic Coordinate Systems or Projected
Coordinate Systems files. Or, Import an
appropriate coordinate system from an existing
shapefile that is already projected and known to
be correct.
Easier
11
Handling an Unknown Coordinate System
10 Check again for an appropriate coordinate
system. 11 Run the wizard. 12 Right-click on
the layer name and click the Properties. 13 In
the Layer Properties, click the Source tab. 14
Verify the information in Extent and Data Source
box.
12
Mapping
Maps are a vehicle that may transfer your ideas
about a place into the mind of a map reader. The
best map is one that easily communicates its
specific message to the viewer, and portray the
important details of the data in their true
relation. Cartographic Map Topographic
Map Designed especially to support a general
exploration and discussion of the essential
physical and cultural components of a place and
its pertinent surroundings and their relationship
with each other. Thematic Map Designed to
communicate more abstract quantitative or
qualitative observations of entities or areas
within and around the subject.
Source http//www.gsd.harvard.edu/gis/manual/styl
e/index.htm
13
Mapping
Elements for a Map Title indicates the purpose of
the map Legend making key distinctions of
important components Scale Bar a ruler to measure
distances (NEVER use fraction eg.
12,000) Caption explains the critical concepts
and relationships Labeled Elements reference
features to illustrate the location Source of the
Data the name of authority responsible for the
content of the data, and/or the time period that
the data is representing Projection
Method indicate the planimetric scale properties
Source http//www.gsd.harvard.edu/gis/manual/styl
e/index.htm
14
Mapping
Example of a Decent Regional Context Map
Source http//www.gsd.harvard.edu/gis/manual/styl
e/index.htm
15
Mapping
Example of a Decent Regional Context Map
Source http//www.gsd.harvard.edu/gis/manual/styl
e/index.htm
16
Mapping
Example of a Decent Regional Context Map
Source http//www.gsd.harvard.edu/gis/manual/styl
e/index.htm
17
Mapping
Quantitative Measurements Multitude (or number) a
series of symbols of unique meaning in a fixed
order that can be derived by counting. Magnitude a
property that can be described by a real number,
such as the volume of a sphere. Modes of
Representation Proportional Symbols portray a
statistic as a symbol that is scaled in
proportion to the quantity of the aggregation
area. Symbols that scale in one dimension (e.g.
height) according to the value of the statistic
are appropriate for visualizing and comparing raw
count statistics. Choroplenth Symbols use the
geographic area itself as a symbol. Using shades
of increasing color value are appropriate for
portraying and comparing measures of intensity.
Source http//www.gsd.harvard.edu/gis/manual/norm
alize/index.htm
18
Mapping
It is very easy to create maps that communicate
wrong ideas.
Which jar contains the most amount of water?
Which jar contains the most concentrated water?
Source http//www.gsd.harvard.edu/gis/manual/norm
alize/index.htm
19
Mapping
- Choropleth Map
- shades geographical areas according to
statistical tabulation - very effective in creating a mental impression
of the spatial pattern of statistical information - Problem
- When characterizing these areas by counts, the
comparison is based on unequal terms. - the areas are almost always arbitrary in size
and population - Normalization
- Transform a set of measurements to factor out the
size of the domain over unequal areas or
populations. - transforms measures of magnitude (counts or
weights) into measures of intensity - Population Density Count of Population / Land
Area - Unemployment Rate Count of unemployment /
Number of Workforce
Source http//www.gsd.harvard.edu/gis/manual/norm
alize/index.htm
20
Mapping
A Meaningful Choropleth Map
- Census Tract
- a geographic region defined for the purpose of
taking a census - often arbitrary, except for coinciding with
political boundary
Source http//www.gsd.harvard.edu/gis/manual/norm
alize/index.htm
21
Mapping
Choosing an Appropriate Scale
Tracts
Block Groups
To protect the confidentiality of individuals,
the United States Census Bureau releases only
summary statistics for geographic areas of
Tracts, Block Groups, and Blocks.
Blocks
Source http//www.gsd.harvard.edu/gis/manual/cens
us/index.htm
22
Mapping
US Census Geographic Types
100-percent characteristics (short from) A
limited number of questions were asked for every
person and housing unit in the United
States. Sample characteristics (long
form) Additional questions were asked of a sample
(generally 1-in-6) of person and housing units.
Source http//www.census.gov/prod/2001pubs/mso-01
icdp.pdf
Recommended
CrystalGraphics Presentations


