
Trading on Nord Pool - PowerPoint PPT Presentation
1 / 35
Title:
Trading on Nord Pool
Description:
Electricity spot prices on Nord Pool in 2006, Stockholm price area. Source: Nord Pool ... and price of emissions allowances on Nord Pool. Source: Nord Pool ... – PowerPoint PPT presentation
Number of Views:216
Avg rating:3.0/5.0
Title: Trading on Nord Pool
1
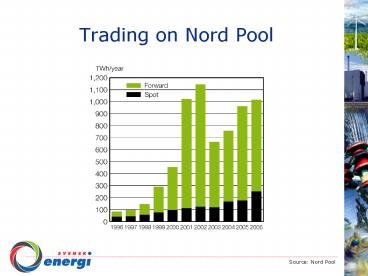
Trading on Nord Pool
Source Nord Pool
2
Electricity spot prices on Nord Pool in 2006,
Stockholm price area
Source Nord Pool
3
Electricity spot prices on Nord Pool and EEX
(Germany)
Source Nord Pool, EEX
4
Spot price, forward price and price of emissions
allowances on Nord Pool
Source Nord Pool
5
Price of emissions allowances on Nord Pool
Source Nord Pool, EEX
6
Price of emissions allowances and differences
between spot and forward prices on Nord Pool and
the German power exchange
Source Nord Pool, EEX
7
Changes in the number of electricity suppliers
and Distribution System Operators since 1976
Source Swedenergy
8
Number of supplier switches per month
Source Statistics Sweden
9
Customer mobility 2001-2007
Source Statistics Sweden
10
Breakdown of total electricity price for a
single-family home with electrical heating and a
variable rate contract, 1990 prices
Source Swedish Energy Agency and Statistics
Sweden
11
Total energy supply in Sweden 1973-2006
Source Statistics Sweden
12
Total supplied energy in relation to GNP
1973-2006 (1995 prices)
Source Statistics Sweden
13
Electricity usage as a function of GNP 1970-2006
(1995 prices)
Source Statistics Sweden
14
Breakdown of electricity usage by sector 1970-2006
Source Statistics Sweden
15
Industrial electricity consumption in relation to
value added1970-2006 (1991 prices)
Source Statistics Sweden
16
Household electricity consumption by
application, preliminary result year 2007
Source Swedish Energy Agency
17
Power generation in Sweden by power type, TWh/year
Source Swedenergy
18
Runoff variations in relation to normal year
runoff 1952-2006
Source Swedenergy
19
Runoff variations in the power-generating rivers
Source Swedenergy
20
Storage levels in the regulating reservoirs
Source Swedenergy
21
Average monthly generation of wind power in
relation toelectricy users profile
Source Swedenergy
22
Installed power generation capacity in thermal
power district heating respectively industrial
back-pressure 20022006
Source Swedenergy
23
Power generation by fuels in thermal power
district heating respectively industrial
back-pressure 20022006
Source Swedenergy
24
Development of renewable electricity generation
2000-2006
Source Swedenergy
25
Ownership of power generation capacity
Source Swedenergy
26
Changes in ownership of power generation capacity
1996-2006
Source Swedenergy
27
Power generation and consumption in Sweden
2004-2006, TWh/week
Source Swedenergy
28
Power generation and consumption in Nordic region
2004-2006, TWh/week
Source Nord Pool
29
Hourly load profile for electricity usage with
peak demand in 2006 and typical 24-hour period
in winter and summer
Source Svenska Kraftnät and Swedenergy
30
Net flow of electricity to and from Sweden per
country in 2004-2006
Source Svenska Kraftnät
31
Swedish emissions of sulphur dioxide 1990-2005
Source Swedish Environmental Objectives Council
32
Swedish nitrogen oxide emissions 1990-2005
Source Swedish Environmental Objectives Council
33
Emissions of CO2 equivalents in the world, tonnes
per capita
Source Swedish Environmental Protection Agency
34
Swedish emissions of greenhouse gases 1990-2005
Source Swedish Environmental Objectives Council
35
Development of electricity tax (energy tax on
electricity) since 1951
Sources Statistics Sweden, Swedish Energy Agency