
Putting supply and demand together . . . - PowerPoint PPT Presentation
1 / 11
Title:
Putting supply and demand together . . .
Description:
Putting supply and demand together . . . price ($/lb.) quantity (lbs./week) ... If the market starts off out of equilibrium, market forces ... – PowerPoint PPT presentation
Number of Views:411
Avg rating:3.0/5.0
Title: Putting supply and demand together . . .
1
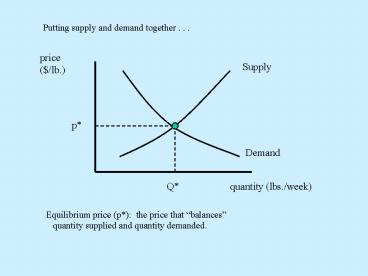
Putting supply and demand together . . .
Equilibrium price (p) the price that
balances quantity supplied and quantity
demanded.
2
- Equilibrium price (p) Market-clearing price.
- The price at which quantity supplied equals
quantity demanded. This quantity is called the .
. . - Equilibrium quantity (Q)
- In equilibrium, desires are balanced . . .
- . . . Everyone who is willing and able to buy
can find someone willing and able to sell. - Do we have to rely on luck to bring about
equilibrium?
3
If the market starts off out of equilibrium,
market forces (actions of buyers and sellers)
tend to move the market toward equilibrium
over time.
Disappointed suppliers will undercut rivals
prices, driving price down toward
equilibrium.
4
Suppose price starts out below the
equilibrium level
Disappointed demanders will bid up the price,
driving price up toward equilibrium.
5
- Analyzing changes in equilibrium
- (This is what the supply and demand model
is really good for.) - Some event (X, lets say) has an effect on the
market for a good, leading to a change in
equilibrium. - How will the new equilibrium price and quantity
compare to the old? - (When X occurs, other things equal,
equilibrium price will ______ and equilibrium
quantity will ______.)
6
- Comparative static analysis
- ( . . . because it involves a comparison of
static equilibria, rather than analysis of
dynamics How do price and quantity adjust as
we go from old equilibrium to new?) - Method
- 1. Decide whether event shifts supply or demand
(maybe both) - 2. Decide direction of shift(s).
- 3. Use supply and demand graph to see how shift
changes equilibrium.
7
Suppose that the price of a substitute increases
. . .
1. Demand shifts.
2. Demand shifts to the right (increase in
demand)
3. Equilibrium price and quantity both
increase.
8
Suppose that the price of an input increases . . .
1. Supply shifts.
2. Supply shifts to the left (decrease in
supply)
3. Equilibrium price increases and equilibrium
quantity decreases.
9
- On your own, you should analyze effects of a
decrease in demand . . . - (for example, the good is inferior and
income increases) - . . . and the effects of an increase in supply
- (for example, a technological innovation
reduces production costs). - But what about the possibility of simultaneous
shifts of both curves?
10
Can we conclude that equilibrium price and
quantity both increase?
Not necessarily! Equilibrium quantity
definitely increases. But change in
equilibrium price depends on magnitudes of
shifts.
11
When both curves shift simultaneously, is the
(direction of) the change in equilibrium price
always ambiguous?
No. Consider a demand increase combined with a
supply decrease.
p goes up -- but Q change is ambiguous.
Recommended
CrystalGraphics Presentations


