
Homeostatic - PowerPoint PPT Presentation
1 / 60
Title:
Homeostatic
Description:
Ions are arranged in a repeating three-dimensional pattern, forming a crystal. The formula of an ionic compound gives the smallest possible integer number of ... – PowerPoint PPT presentation
Number of Views:59
Avg rating:3.0/5.0
Title: Homeostatic
1
(No Transcript)
2
(No Transcript)
3
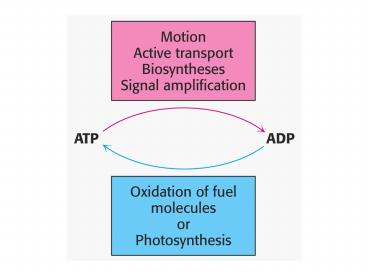
Homeostatic conditions
4
Fig 16.2
5
Catabolic pathways
Anabolic pathways
See Figure 16.3
6
Figure 16.20
7
Figure 16.25
8
Table 16.3
9
(No Transcript)
10
(No Transcript)
11
(No Transcript)
12
Most oxidized
Least oxidized
13
Reduced substrates
Oxidized substrates
Oxidized cofactors
Reduced cofactors
14
Fig 17.3
15
(No Transcript)
16
Figure 16-21b Some overall coupled reactions
involving ATP. (b) The phosphorylation of ADP by
phosphoenolpyruvate to form ATP and pyruvate.
Page 567
17
Biol/Chem 472 Expected Outcomes
- draw enzymatic reactions correctly
- correctly calculate DGº and DG for a given step
or a series of steps in a pathway - rationalize and/or predict features of pathway
regulation and describe regulatory mechanisms - recognize how concentrations of metabolites are
regulated and the impact that changes in flux
and/or concentration will have on other
processes.
18
Figure 17-1 Glycolysis.
Page 582
19
Figure 17-3 Degradation of glucose via the
glycolytic pathway. All steps occur in the
cytosol.All enzymes are homodimers or
homotetramers!
Page 584
Buchner!!!
20
Table 17-1 Standard Free Energy Changes (DG),
and Physiological Free Energy Changes (DG) in
Heart Muscle, of the Reactions of Glycolysisa.
Page 613
21
Figure 17-4 The nucleophilic attack of the C6OH
group of glucose on the g phosphate of an
Mg2ATP complex.
Page 585
22
Figure 16-7 The phosphoryl-transfer reaction
catalyzed by hexokinase.
Page 555
23
Figure 17-5a Conformation changes in yeast
hexokinase on binding glucose. (a) Space-filling
model of a subunit of free hexokinase. (b)
Space-filling model of a subunit of free
hexokinase in complex with glucose (purple).
This same change in conformation is observed for
ALL kinases! It also accounts for the fact
that water cannot be used for hydrolysis of ATP
unless we fool the enzyme by using xylose
instead of glc.
Page 586
Page 586
24
Phosphoglucose isomerase (PGI)
pKs for active site 6.7 and 9.3 (determined by
rate vs. pH) Which aas??
Actually Glu (!!!) and His with stabilization of
His by a Glu (remember the ser protease
mechanism!)
25
Figure 17-6 Reaction mechanism of phosphoglucose
isomerase.
General Acid/Base Catalysis
Page 587
26
RATE DETERMINING STEP OF GLYCOLYSIS!
Phosphofructokinase (PFK)
Works exactly like HK.
Inhibited by hi ATP or citrate
Activated by AMP even in the presence of hi
ATP.
27
28
Figure 17-7 Base-catalyzed isomerization of
glucose, mannose, and fructose.
NOT produced by PGI!
Page 588
29
Figure 17-8 Mechanism for base-catalyzed aldol
cleavage.
Page 589
Transition state analogs like 2-phosphoglycolate
inhibit the enzyme
30
Figure 17-9 Enzymatic mechanism of Class I
aldolase.
Page 590
31
Enzyme-Substrate Complex trapped by reduction of
DHAP with NaBH4 followed by hydrolysis
32
Page 557
Figure 16-10 Mechanism of aldoseketose
isomerization.
33
Figure 17-10 Proposed enzymatic mechanism of the
TIM reaction General Acid Catalysis.
pKs 6.5 and 9.5 Like PGI But pK1 is for GLU!
Normal pk?
4.1
Glu?Asp ? activity by 1000!
Reaction rate is diffusion limited!!
34
GAP DH
Start of energy producing phase of glycolysis
Production of the first hi energy molecule.
35
Figure 17-13a Some reactions employed in
elucidating the enzymatic mechanism of GAPDH. (a)
The reaction of iodoacetate with an active site
Cys residue. (b) Quantitative tritium transfer
from substrate to NAD.
Page 596
32Pi also incorporated
36
Figure 17-14 Enzymatic mechanism of
glyceraldehyde-3 phosphate dehydrogenase.
?Go 6.7 kJ!
Page 596
37
Figure 17-15 Space-filling model of yeast
phosphoglycerate kinase showing its deeply
clefted bilobal structure.
Page 597
38
Figure 17-16 Mechanism of the PGK reaction.
?Go -12.1 kJ
?Go -49.4 kJ!
Page 597
39
Phosphoglucomutase--PGM
Mutases move functional groups 3PG?2PG
40
Figure 17-17 The active site region of yeast
phosphoglycerate mutase (dephospho form) showing
the substrate, 3-phosphoglycerate, and some of
the side chains that approach it.
Page 598
41
Figure 17-18 Proposed reaction mechanism for
phospho-glycerate mutase.
Phosphorylated active site
Bisphospho- intermediate.
Page 599
42
Figure 17-19 The pathway for the synthesis and
degradation of 2,3-BPG in erythrocytes is a
detour from the glycolytic pathway.
Page 600
43
Figure 17-20 The oxygen-saturation curves of
hemoglobin (red) in normal erythrocytes and those
from patients with hexokinase (green) and
pyruvate kinase deficiencies (purple).
?BPG
? BPG
Page 600
44
Figure 17-21 Proposed reaction mechanism of
enolase.
F- binds Pi Mg2 Potent inhibitor
Page 601
45
Figure 17-22 Mechanism of the reaction catalyzed
by pyruvate kinase.
Page 602
46
Figure 17-23 The active site region of porcine H4
LDH in complex with S-lac-NAD, a covalent adduct
of lactate and NAD.
Page 603
47
Figure 17-24 Reaction mechanism of lactate
dehydrogenase.
Page 603
48
Figure 17-25 The two reactions of alcoholic
fermentation.
Page 604
49
Figure 17-26 Thiamine pyrophosphate.
Page 604
50
Figure 17-27 Reaction mechanism of pyruvate
decarboxylase.
Page 605
51
Figure 17-29 The formation of the active ylid
form of TPP in the pyruvate decarboxylase
reaction.
Page 606
52
Figure 17-30 The reaction mechanism of alcohol
dehydrogenase involves direct hydride transfer of
the pro-R hydrogen of NADH to the re face of
acetaldehyde.
Page 606
53
Table 17-2 Some Effectors of the Nonequilibrium
Enzymes of Glycolysis.
Page 613
54
Figure 17-32a X-Ray structure of PFK. (a) A
ribbon diagram showing two subunits of the
tetrameric E. coli protein.
Mg2
F6P
Page 614
ATP
55
Figure 17-33 PFK activity versus F6P
concentration.
Page 615
56
Figure 17-35 Metabolism of fructose.
Page 619
57
Figure 17-36 Metabolism of galactose.
Page 621
58
Figure 17-37 Metabolism of mannose.
Page 621
59
Figure 17-31 Schematic diagram of the plasmid
constructed to control the amount of citrate
synthase produced by E. coli.
Page 609
60
Alfonse, Biochemistry makes my head hurt!!
\
Recommended
CrystalGraphics Presentations


