
Note to users - PowerPoint PPT Presentation
1 / 61
Title:
Note to users
Description:
Population by county, age, race/ethnicity; and population change. County data (for 28 of 90 benchmarks) from the November, 2005 Oregon Benchmarks ... – PowerPoint PPT presentation
Number of Views:39
Avg rating:3.0/5.0
Title: Note to users
1
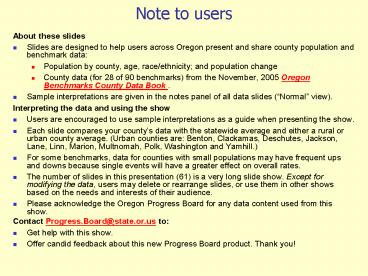
Note to users
- About these slides
- Slides are designed to help users across Oregon
present and share county population and benchmark
data - Population by county, age, race/ethnicity and
population change - County data (for 28 of 90 benchmarks) from the
November, 2005 Oregon Benchmarks County Data Book
. - Sample interpretations are given in the notes
panel of all data slides (Normal view). - Interpreting the data and using the show
- Users are encouraged to use sample
interpretations as a guide when presenting the
show. - Each slide compares your countys data with the
statewide average and either a rural or urban
county average. (Urban counties are Benton,
Clackamas, Deschutes, Jackson, Lane, Linn,
Marion, Multnomah, Polk, Washington and Yamhill.) - For some benchmarks, data for counties with small
populations may have frequent ups and downs
because single events will have a greater effect
on overall rates. - The number of slides in this presentation (61) is
a very long slide show. Except for modifying the
data, users may delete or rearrange slides, or
use them in other shows based on the needs and
interests of their audience. - Please acknowledge the Oregon Progress Board for
any data content used from this show. - Contact Progress.Board_at_state.or.us to
- Get help with this show.
- Offer candid feedback about this new Progress
Board product. Thank you!
2
WALLOWA COUNTY Is it making progress?
- A slide show on Wallowa Countybased on the
- Oregon Benchmarks County Data Book
- November, 2005
- Oregon Progress Board
- www.oregon.gov/DAS/OPB
3
Introduction
- What is the Oregon Progress Board?
- What are Oregon Benchmarks?
- Categories of Benchmarks
4
What is the Oregon Progress Board?
- A state board
- Created by the Legislature in 1989
- Responsible for monitoring the state's 20-year
strategic vision, Oregon Shines - Oregon Benchmarks are the measures used to
monitor progress.
5
What are Oregon Benchmarks?
- 90 societal measures of progress towards three
Oregon Shines goals - 1) Quality jobs for all Oregonians
- 2) Safe, caring engaged communities
- 3) Healthy, sustainable surroundings
- 28 of the 90 benchmarks have county-level data
and are shown here for Wallowa County. - Statutory reference (ORS 285A.168)
6
This show is organized by benchmark categories
- Economy
- Education
- Civic Engagement
- Social Support
- Public Safety
- Community Development
- Environment
- Complete list of 90 Oregon Benchmarks
- www.oregon.gov/DAS/OPB/2005report/obm_list.shtml
7
But first, some data about Wallowa Countys
population
- Population by county
- Population change over time
- Population by age
- Population by race
- Percent that is Hispanic
8
Population by county, 2005
Wallowa
Wheeler
Source Portland State University Population
Research Center (Certified Estimates)
9
Percent and source of change in population,
1990-2000 and 2000-2004
Source Portland State University, Population
Research Center
10
Population by age, 1994 and 2004
Oregon
Wallowa County
Source Oregon Office of Economic Analysis
11
Population by race, 2000 and 2004(Hispanics, an
ethnic group, are represented in all racial
categories).
Source US Census Bureau County Population
Estimates
12
Percent that is Hispanic, 1994 2004
Wallowa
State
Source Oregon Office of Economic Analysis
13
How to read benchmark slides
- Blue bar Wallowa County
- Statewide average
- Rural county average
- Rural counties Baker, Clatsop, Coos, Crook,
Curry, Douglas, Gilliam, Grant, Harney, Hood
River, Jefferson, Josephine, Klamath, Lake,
Lincoln, Malheur, Morrow, Sherman, Tillamook,
Umatilla, Union, Wallowa, Wasco, Wheeler
14
Economy
- Business Vitality
- Net Job Growth
- Professional Services
- Income
- Per Capita Income
- Pay Per Worker
- Unemployment
15
Net job growth (loss) per 1,000 population
Oregon Benchmark 4
Source Covered Employment and Payrolls, Oregon
Employment Department
16
Concentration of professional services relative
to the U.S. (U.S.100)
Oregon Benchmark 5
Source Oregon Employment Department and the
U.S. Bureau of Labor Statistics
17
Per capita personal income as percent of the U.S.
per capita income
Oregon Benchmark 11
Source Oregon Employment Department
18
Average annual payroll per covered worker (all
industries) 2004 dollars
Oregon Benchmark 12
Source Oregon Employment Department. Figures
are converted to 2004 dollars using the U.S.
Implicit Price Deflator for Personal Consumption
Expenditures
19
Unemployment rate as a percent of U.S.
unemployment rate
Oregon Benchmark 15
Source Oregon Employment Department
20
Education
- K-12
- Ready to Learn
- 3rd Grade Reading Math
- 8th Grade Reading Math
- High School Dropout Rate
- High School Completion
- Post Secondary
- College Completion
The Education index includes 3rd Grade Reading
Math, 8th Grade Reading Math, and High School
Dropout Rate benchmarks.
21
Percent of children entering school ready to learn
Oregon Benchmark 18
Source Kindergarten Surveys, Oregon Department
of Education
22
Percent of 3rd grade students who achieve
established skills in reading
Oregon Benchmark 19a
OLD STANDARDS
Source Oregon Department of Education, Oregon
Statewide Assessment
23
Percent of 3rd grade students who achieve
established skills in math
Oregon Benchmark 19b
OLD STANDARDS
Source Oregon Department of Education, Oregon
Statewide Assessment
24
Percent of 8th grade students who achieve
established skills in reading
Oregon Benchmark 20a
OLD STANDARDS
Source Oregon Department of Education, Oregon
Statewide Assessment
25
Percent of 8th grade students who achieve
established skills in math
Oregon Benchmark 20b
OLD STANDARDS
Source Oregon Department of Education, Oregon
Statewide Assessment
26
High school dropout rate (grades 9-12 for the
listed school year)
Oregon Benchmark 22
Source Oregon Department of Education, Early
Leaver Fall Report
27
Percent of Oregon adults who have completed high
school (or GED) or more
Oregon Benchmark 23
Source US Census Bureau decennial census
28
Percent of Oregon adults who have completed a
Baccalaureate degree or more
Oregon Benchmark 26a
Source US Census Bureau decennial census
29
Civic Engagement
- Voting
30
Percent of registered voters who participated in
biennial general elections
related to Oregon Benchmark 31
Source Oregon Secretary of State's Office,
Elections Division
31
Social Support Health
- Teen Pregnancy
- Prenatal Care
- Infant Mortality
- HIV Diagnosis
- Premature Death
- Child Care Availability
32
Pregnancy rate per 1,000 females ages 10-17
Oregon Benchmark 39
Source Oregon DHS, Health Services Cluster,
Center for Health Statistics, Oregon Vital
Statistics Annual Report Population Estimates for
Oregon, by the Center for Population Research and
Census, School of Urban and Public Affairs,
Portland State University
33
Percent of babies whose mothers received prenatal
care beginning in the first trimester
Oregon Benchmark 40
Source Oregon Department of Human Services,
Health Services Cluster, Center for Health
Statistics, Oregon Vital Statistics Annual Report
34
Infant mortality rate per 1,000
Oregon Benchmark 41
Data N/A
Source Oregon Department of Human Services,
Health Services Cluster, Center for Health
Statistics, Oregon Vital Statistics Annual Report
35
Number of cases of HIV infection among
adolescents and adults (13 and older)
Oregon Benchmark 43
Note statewide and rural data are sums, not
averages.
Source Oregon Department of Human Services,
Health Services Cluster, Office of Disease
Prevention and Epidemiology, Oregon HIV/AIDS
Annual Report
36
Premature Death Years of life lost before age 70
(per 1,000 population)
Oregon Benchmark 45
Total number of deaths before age 70 is less than
20.
Note prior to 2000, data for central and eastern
counties were aggregated due to small and
fluctuating numbers.
Source Oregon DHS, Health Services Cluster,
Center for Health Statistics, Oregon Vital
Statistics Annual Report Population Estimates for
Oregon by the Center for Population Research and
Census, School of Urban and Public Affairs, PSU
37
Number of child care slots available for every
100 children under age 13
Oregon Benchmark 48
Data n/a
Data n/a
Source Child Care Research Partnership and
Oregon Employment Department, Child Care Division
38
Social Support Protection
- Protection
- Teen Substance Abuse
- Child Abuse or Neglect
- Alcohol/Tobacco During Pregnancy
39
Percent of 8th grade students who report using
alcohol in the previous 30 days
Oregon Benchmark 49a
Source 1990-2000 Oregon Public Schools Drug
Use Survey, for Office of Alcohol and Drug Abuse
Programs 2001 forward Oregon Healthy Teens
Survey, by Oregon Office of Mental Health
Addiction Services and DHS, Health Services
Cluster, Center for Health Statistics
40
Percent of 8th grade students who report using
illicit drugs in the previous 30 days
Oregon Benchmark 49b
Source 1990-2000 Oregon Public Schools Drug
Use Survey, for Office of Alcohol and Drug Abuse
Programs 2001 forward Oregon Healthy Teens
Survey, by Oregon Office of Mental Health
Addiction Services and DHS, Health Services
Cluster, Center for Health Statistics
41
Percent of 8th grade students who report using
cigarettes in the previous 30 days
Oregon Benchmark 49c
Source 1990-2000 Oregon Public Schools Drug
Use Survey, for Office of Alcohol and Drug Abuse
Programs 2001 forward Oregon Healthy Teens
Survey, by Oregon Office of Mental Health
Addiction Services and DHS, Health Services
Cluster, Center for Health Statistics
42
Number of children, who are abused or neglected
or are at risk of abuse or neglect
Oregon Benchmark 50a
Source Oregon Department of Human Services, CAF
Program Performance and Reporting Research Unit
43
Percent of infants whose mothers used alcohol
during pregnancy (self reported)
Oregon Benchmark 52a
Source Oregon DHS, Health Services Cluster,
Center for Health Statistics, Oregon Vital
Statistics Annual Report
44
Percent of infants whose mothers used tobacco
during pregnancy (self reported)
Oregon Benchmark 52b
Source Oregon Department of Human Services,
Health Services Cluster, Center for Health
Statistics, Oregon Vital Statistics Annual
Report
45
Social Support Poverty Independent Living
- Poverty
- Poverty
- Independent Living
- Independent Seniors
46
Percent of population with incomes below 100 of
the federal poverty level
Oregon Benchmark 53
Source Current Population Survey (from US
Bureau of Labor Statistics and US Census Bureau)
47
Percent of seniors living outside of nursing
facilities
Oregon Benchmark 58
Source Oregon Department of Human Services,
Senior and Disabled Services Division
48
Public Safety
- Crime
- Overall Crime
- Juvenile Arrests
49
Overall reported crimes per 1,000 population
Oregon Benchmark 61
Source Oregon State Police, Uniform Crime
Reporting Program. Population estimates are
provided either by official census or estimates
by Portland State University, Population Research
Center
50
Reported crimes against persons per 1,000
population
Oregon Benchmark 61a
Murder, negligent homicide, forcible rape, other
sex crimes, kidnapping, robbery, aggravated
assault and simple assault
Source Oregon State Police, Uniform Crime
Reporting Program. Population estimates are
provided either by official census or estimates
by Portland State University, Population Research
Center
51
Reported property crimes per 1,000 population
Oregon Benchmark 61b
Burglary, larceny/theft, motor vehicle theft,
arson, forgery/counterfeit, fraud, embezzlement,
stolen property, and vandalism
Source Oregon State Police, Uniform Crime
Reporting Program. Population estimates are
provided either by official census or estimates
by Portland State University, Population Research
Center
52
Reported behavioral crimes per 1,000 population
Oregon Benchmark 61c
Weapon laws, prostitution, drug laws, gambling,
crimes against family, driving under the
influence, liquor laws, disorderly conduct, and
all other curfew and runaway juveniles
Source Oregon Department of State Police,
Uniform Crime Reporting Program Population
estimates are provided either by official census
or estimates by Portland State University,
Population Research Center
53
Juvenile arrests for crimes against persons per
1,000 juveniles per year
Oregon Benchmark 62a
Murder, negligent homicide, forcible rape, other
sex crimes, kidnapping, robbery, aggravated
assault and simple assault
Source Oregon State Police, Uniform Crime
Reporting Program. Population estimates are
provided either by official census or estimates
by Portland State University, Population Research
Center
54
Juvenile arrests for property crimes per 1,000
juveniles per year
Oregon Benchmark 62b
Burglary, larceny/theft, motor vehicle theft,
arson, forgery/counterfeit, fraud, embezzlement,
stolen property, and vandalism
55
Community Development
- Housing
- Home Ownership
- Affordable Housing
56
Percent of Oregon households that are owner
occupied
Oregon Benchmark 73
Source 1980 Census of Population and Housing
1990 2000 from the US Census Bureau reports
57
Percent of lower-income, renter households that
are cost-burdened
Oregon Benchmark 74a
Source 1980 Census of Population and Housing
1990 2000 from US Census Bureau
58
Percent of lower-income, owner-occupied
households that are cost-burdened
Oregon Benchmark 74b
Source 1980 Census of Population and Housing
1990 2000 from US Census Bureau
59
Environment
- Land
- Municipal Waste Disposal
60
Pounds of Oregon municipal solid waste landfilled
or incinerated per capita
Oregon Benchmark 83
Source Oregon Department of Environmental
Quality, Land Quality Division
61
Rita Conrad, Acting Executive Director 155
Cottage Street, NE U20 Salem, OR
97301-3966 503-378-3202 Direct Progress.Board_at_stat
e.or.us www.oregon.gov/DAS/OPB
Recommended
CrystalGraphics Presentations


