
Total energy production in Alberta - PowerPoint PPT Presentation
1 / 102
Title:
Total energy production in Alberta
Description:
Geological distribution of conventional marketable gas reserves. Figure 5.8. Remaining conventional marketable reserves of sweet and sour gas. Sweet natural gas ... – PowerPoint PPT presentation
Number of Views:40
Avg rating:3.0/5.0
Title: Total energy production in Alberta
1
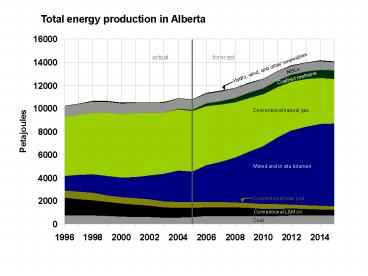
Total energy production in Alberta
2
(No Transcript)
3
Alberta supply of crude oil and equivalent
4
Total marketable gas production and demand
5
(No Transcript)
6
Figure 1.2 OPEC crude basket reference price
7
Figure 1.3 Price of WTI at Chicago
8
Figure 1.4 Average price of oil at Alberta
wellhead
9
Figure 1.5 2005 Average monthly reference prices
of Alberta crudes
10
(No Transcript)
11
Figure 1.7 Average price of natural gas at plant
gate
12
(No Transcript)
13
Figure 1.9 Canadian economic indicators
14
Figure 1.10 Alberta real investment
15
(No Transcript)
16
Figure 2.2. Comparison of Albertas crude oil and
crude bitumen reserves
17
(No Transcript)
18
(No Transcript)
19
(No Transcript)
20
(No Transcript)
21
(No Transcript)
22
Figure 2.8. Alberta crude oil and equivalent
production
23
Figure 2.9. Alberta crude bitumen production
24
Production (103 m3/d)
Figure 2.10. Total in situ bitumen production and
producing bitumen wells
25
Synthetic Crude Oil
Figure 2.11. Alberta synthetic crude oil
production
26
(No Transcript)
27
(No Transcript)
28
Nonupgraded bitumen removals from Alberta
SCO removals from Alberta
Synthetic Crude Oil
Alberta demand (mainly SCO)
Figure 2.14. Alberta demand and disposition of
crude bitumen and SCO
29
Figure 3.1. Remaining established reserves of
crude oil
Heavy
Light-medium
30
Figure 3.3. Annual changes to waterflood reserves
31
Figure 3.2. Annual changes in conventional crude
oil reserves
32
Remaining reserves (103m3)
Total number of pools (103m3)
Initial reserves (103m3)
Figure 3.4. Distribution of oil reserves by size
33
Figure 3.5. Oil pool size by discovery year
34
(No Transcript)
35
Figure 3.7. Geological distribution of reserves
of conventional crude oil
36
(No Transcript)
37
Figure 3.9. Albertas remaining established oil
Reserves versus cumulative production
38
Figure 3.10. Growth in initial established
reservesof crude oil
39
(No Transcript)
40
(No Transcript)
41
(No Transcript)
42
Figure 3.14. Conventional crude oil production by
modified PSAC area
43
Figure 3.15. Total crude oil production and
producing oil wells
44
Figure 3.16. Crude oil well productivity in 2005
45
of total production from oil wells
Figure 3.17. Total conventional crude oil
production by drilled year
46
Texas onshore
Alberta crude oil
Louisiana onshore
Figure 3.18. Comparison of crude oil production
47
Figure 3.19. Alberta crude oil price and well
activity
48
Heavy
Light-medium
Figure 3.20. Alberta daily production of crude oil
49
Figure 3.21. Capacity and location of Alberta
refineries
50
Crude oil removals from Alberta
Alberta demand
Figure 3.22. Alberta demand and disposition of
crude oil
51
Figure 3.23. Alberta supply of crude oil and
equivalent
52
Figure 3.24. Alberta crude oil and equivalent
production
53
(No Transcript)
54
(No Transcript)
55
Figure 4.3 Coalbed methane production forecast
56
Figure 5.1. Annual reserves additions and
production of conventional marketable gas
57
Figure 5.2. Remaining conventional marketable gas
reserves
58
Figure 5.3. New, development, and revisions to
conventional marketable gas reserves
59
(No Transcript)
60
Total number of pools (106m3)
Remaining reserves (109m3)
Initial reserves (109m3)
Figure 5.5. Distribution of conventional gas
reserves by size
61
Figure 5.6. Conventional gas pools by size and
discovery year
62
Figure 5.7. Geological distribution of
conventional marketable gas reserves
63
Figure 5.8. Remaining conventional marketable
reserves of sweet and sour gas
Sweet natural gas
Sour natural gas
64
Figure 5.9. Expected recovery of conventional
natural gas components
65
Figure 5.10. Growth in initial established
reserves of conventional marketable gas
66
Figure 5.11. Conventional gas ultimate potential
Remaining reserves
Production
67
(No Transcript)
68
Figure 5.13. Conventional gas in place by
geological period
69
(No Transcript)
70
Figure 5.15. Successful conventional gas wells
drilled and connected
71
(No Transcript)
72
(No Transcript)
73
of total production from oil wells
2
4
3
12
5
20
38
5
10
Connection year
Figure 5.18. Marketable gas production by
modified PSAC area
74
Figure 5.19. Conventional marketable gas
production and number of producing wells
75
Figure 5.20. Natural gas well productivity in 2005
76
of total production from oil wells
3
Connection year
Figure 5.21 Raw gas production by connection year
77
Figure 5.22 Average initial natural gas well
productivity in Alberta
78
Figure 5.23. Alberta natural gas well activity
and price
79
Figure 5.24. Conventional marketable gas
production
80
Figure 5.25. Historical volumes available for
permitting
81
Texas onshore
Louisiana onshore
Alberta
Figure 5.26. Comparison of natural gas production
82
Figure 5.27. Gas production from bitumen
upgrading and bitumen wells
83
Figure 5.28. Total gas production in Alberta
84
(No Transcript)
85
Figure 5.30. Alberta natural gas storage
injection/withdrawal volumes
86
Figure 5.31. Alberta marketable gas demand by
sector
87
Figure 5.32. Gas demand for bitumen recovery and
upgrading
Some 1.2 109m3 of process gas not shown on this
chart is used for electricity generation
(2006-2015).
88
Figure 5.33. Total marketable gas production and
demand
89
Figure 6.1. Remaining established NGL reserves
expected to be extracted from conventional gas
and annual production
90
Figure 6.2. Remaining established reserves of
conventional natural gas liquids
91
(No Transcript)
92
Excludes solvent flood volumes
Figure 6.4. Ethane supply and demand
93
Excludes solvent flood volumes
Figure 6.5. Propane supply from natural gas and
demand
94
Excludes solvent flood volumes
Figure 6.6. Butanes supply from natural gas and
demand
95
Excludes solvent flood volumes
Figure 6.7. Pentanes plus supply from natural gas
and demand
96
Refining and upgrading
Sour gas
Figure 7.1. Sources of sulphur production
97
Figure 7.2. Sulphur production from oil sands
98
Figure 7.3. Canadian sulphur offshore exports
99
Stockpile
Removed from Alberta
Alberta demand
Figure 7.4. Sulphur demand and supply in Alberta
100
Figure 8.1 Total coal production
101
(No Transcript)
102
Figure 8.3. Alberta marketable coal production