
Climate change and Global Warming Update - PowerPoint PPT Presentation
1 / 23
Title:
Climate change and Global Warming Update
Description:
Changing ellipticity: How does this change solar insolation and temperature? ... Variation in Solar Insolation (tan plot) vs. temperature metrics. Solar ... – PowerPoint PPT presentation
Number of Views:138
Avg rating:3.0/5.0
Title: Climate change and Global Warming Update
1
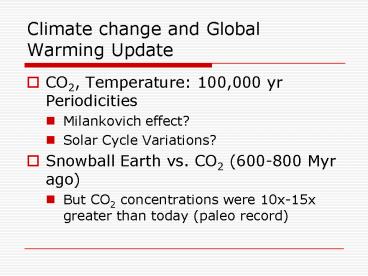
Climate change and Global Warming Update
- CO2, Temperature 100,000 yr Periodicities
- Milankovich effect?
- Solar Cycle Variations?
- Snowball Earth vs. CO2 (600-800 Myr ago)
- But CO2 concentrations were 10x-15x greater than
today (paleo record)
2
Global temperature rapid rise in past 100 years,
1000 yrs
Rapid temperature rise coincident with industrial
revolution (fossil fuel burning)
3
(No Transcript)
4
Sea levels are rising rapidly
5
Global Warming 1 China will pass USA in CO2
emissions in 3 years
But. CO2 emission per capita is still far larger
in USA (1/4 population gt 4x CO2 emission per
person)
6
CO2 variations past 500,000 yrs tracks ice-age
cycles
Note that current CO2 concentration is the
largest (by a factor of 2) in last 500,000 yrs
What causes the 100,000 year periodicities?
7
Vostok (Antarctica) ice cores dust correlates
with temperature, CO2 variations
CO2 concentration closely correlate with global
temperatures (and dust)
8
Recent climate change Global Ice cover (present
and 20,000 yr ago last ice age)
9
- Q. Which statement is incorrect?
- CO2 levels are highest during periods of
glaciation - There is a 100,000 yr periodicity to both
temperature and CO2 concentrations - The present atmospheric CO2 concentration is
twice as high as at any time the past 500,000 yrs - Ice core samples show increased dust
concentration just before periods of glaciation - Global sea levels have risen 20 cm in the past
120 yrs.
10
- Do Earths orbital variations drive long-term
climate change? - Milankovich cycles
11
Milankovich effect
- Earth orbital parameters ellipticity, obliquity,
precession vary periodically
Obliquity, P40,000 yr (22.1- 24.5, now 23.5)
Eccentricity, P413,000 yr (0.005 0.058,now
0.017)
Precession, P26,000 yr Change in orientation of
spin axis of Earth
12
Variation in orbital parameters over 400,000 yrs
Now
13
Changing ellipticity How does this change solar
insolation and temperature?
14
Does solar forcing due to orbital variations
correlate with the glaciation record?
Compare these plots
15
Variation in Solar Insolation (tan plot) vs.
temperature metrics
16
- Solar luminosity variations
- driver for climate change?
17
Are solar variations (partly) driving increasing
global temperatures?
18
Sunspot activity over 400 yrs
19
How much solar flux increase is required to
explain temperature rise in last century?
- Last 100 yr has seen ?T 0.8C
- Range in Lsun is 1 W for solar max to solar min
- Differentiate T(L) L1/4 gives
- ?T/T ¼ (?L/L)
- ?L/L 1/1367 0.00073
- So ?T/T 0.00018
- So ?T 0.045C
- This is only 6 of observed change
20
- Long term climate changes (500 Myr)
21
Snowball Earth ages
22
(No Transcript)
23
Long-term history of CO2 concentration (550 Myr
ago- present)
CO2 levels are 10x-15x present values!
(model-dependent)