
Interpreting the geography of dental health - PowerPoint PPT Presentation
1 / 1
Title:
Interpreting the geography of dental health
Description:
... health. Geographic information shows the impact of fluoridation on tooth decay ... flouride dose and the results of the annual survey of dental decay in children. ... – PowerPoint PPT presentation
Number of Views:53
Avg rating:3.0/5.0
Title: Interpreting the geography of dental health
1
Interpreting the geography of dental health
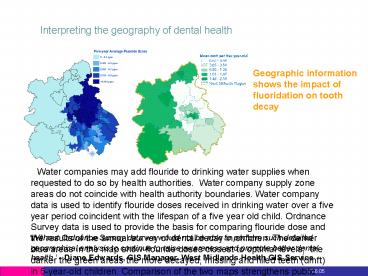
- Geographic information shows the impact of
fluoridation on tooth decay
Water companies may add flouride to
drinking water supplies when requested to do so
by health authorities. Water company supply zone
areas do not coincide with health authority
boundaries. Water company data is used to
identify flouride doses received in drinking
water over a five year period coincident with the
lifespan of a five year old child. Ordnance
Survey data is used to provide the basis for
comparing flouride dose and the results of the
annual survey of dental decay in children. The
darker blue areas in the map show flouride doses
closest to optimal levels the darker the green
areas the more decayed, missing and filled teeth
(dmft) in 5-year-old children. Comparison of the
two maps strengthens public health advice that
flouride is effective at reducing dental decay in
the population and especially in young developing
teeth.
Without Ordnance Survey data we would not
be able to perform such detailed geographical
analysis to continue to raise awareness and
promote better dental health. - Diane Edwards,
GIS Manager, West Midlands Health GIS Service
Recommended
CrystalGraphics Presentations


