
Gravel - PowerPoint PPT Presentation
1 / 1
Title: Gravel
1
Amber D. York1,2, Scott M. Gallager1,2, Richard
Taylor2, Norman Vine2, Jonathan Howland1, Steve
Lerner1,Lakshman Prasad3, Sriram Swaminarayan3,
Dvora Hart4, Gregg Rosenkranz5, Larry Mayer6,
Yuri Rzhanov6.
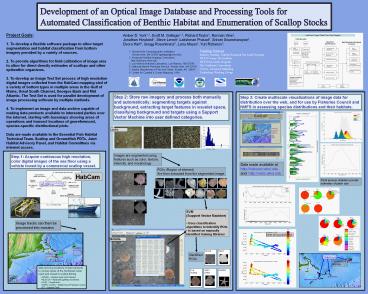
Project Goals 1. To develop a flexible software
package to allow target segmentation and habitat
classification from bottom imagery provided by a
variety of sources. 2. To provide algorithms for
field calibration of image area to allow for
direct density estimates of scallops and other
epibenthic organisms. 3. To develop an Image
Test Set process of high resolution digital
images collected from the HabCam mapping sled of
a variety of bottom types in multiple areas in
the Gulf of Maine, Great South Channel, Georges
Bank and Mid Atlantic. The Test Set is used for
parallel development of image processing software
by multiple methods. 4. To implement an image
and data archive capable of making data products
available to interested parties over the
internet, starting with basemaps showing areas of
operations and transect locations of
georeferenced, species-specific distributional
plots. Data are made available to the Essential
Fish Habitat Technical Team, Scallop and
Groundfish PDTs, Joint Habitat Advisory Panel,
and Habitat Committees via internet access.
Funding Sources Industry funding Scallop
Research Set Aside Program WHOI Ocean Life
Institute WHOI Sea Grant Program The Northeast
Consortium NOAA Advanced Sampling Technology
Working Group
1. Woods Hole Oceanographic Institution,
Woods Hole, MA 02543 sgallager_at_whoi.edu 2.
Advanced Habitat Imaging Consortium,
http//habcam.whoi.edu 3. Los Alamos National
Laboratory, Los Alamos, NM 87545 4. National
Marine Fisheries Service, Woods Hole, MA 02543 5.
Alaska Department of Fish and Game, Kodiak, AK
99615 6. Center for Coastal Ocean Mapping, UNH
Step 2 Store raw imagery and process both
manually and automatically segmenting targets
against background, extracting target features in
wavelet space, classifying background and targets
using a Support Vector Machine into user defined
categories.
Step 3 Create multiscale visualizations of image
data for distribution over the web, and for use
by Fisheries Council and NMFS in assessing
species distributions and their habitats.
AUTO
Number of Polygons
Polygon Area
Images are segmented using features such as
color, texture, intensity, and morphology
Step 1 Acquire continuous high resolution, color
digital images of the sea floor using a vehicle
towed by a commercial scallop vessel.
Data made available at http//habcam.whoi.edu and
http//nebo.whoi.edu
ROIs (Region of interest) Are then extracted from
the segmented image
HabCam
Point process statistics provide estimates of
patch size
- SVM
- (Support Vector Machine)
- Uses classification algorithms to Indentify ROIs
- Is based on manually identified training
libraries
Image tracks can then be processed into mosaics
Note strong patchiness
MANUAL
HAPC
Gravel
Sand
CLA I
WGSC
Identified ROIs
NLSCLA
- an invasive tunicate
Map showing locations of ship transects in
various areas of the Northeast coast open and
closed to scallop fishing
Live Scallop
Sand Dollar
Seastar
ET
- WGSC Western Great South Channel
- NLSCLA Nantucket Lightship Closed Area
- CLAI Closed Area I
- HAPC (CLAII) Habitat Area of Particular Concern
- ET Elephant Trunk