
The Shipley Institute of Living Scale SILS was originally developed in 1940 as a a brief assessment - PowerPoint PPT Presentation
1 / 1
Title:
The Shipley Institute of Living Scale SILS was originally developed in 1940 as a a brief assessment
Description:
VOC, ABS, and TOTAL based on two age groups (18-29, 30-60) and three education groups ... WAIS-III VCI=63.886 1.471(Educ) 0.207(TOT SS) 9.65 .49 ... – PowerPoint PPT presentation
Number of Views:367
Avg rating:3.0/5.0
Title: The Shipley Institute of Living Scale SILS was originally developed in 1940 as a a brief assessment
1
Shipley Institute of Living Scale Australian
Normative Data
Sharron Dawes, B.Sc. (Hons)., Graeme J. Senior,
PhD., Department of Psychology, Faculty of
Sciences, University of Southern Queensland,
Toowoomba, Queensland, AUSTRALIA
INTRODUCTION The Shipley Institute of Living
Scale (SILS) was originally developed in 1940 as
a a brief assessment of intellectual functioning
(Zachary, 1991). It is a self-administered test
consists of two subtests Vocabulary (Voc)
Abstraction (Abs). This normative data updates
the norms, substantially reduces the complexity
of the scoring analyses to reflect more
contemporary approaches to discrepancy analysis,
and provides equations for predicting WAIS-III
VIQ and VCI components. PARTICIPANTS 405
Community volunteers Mean Age 32.03 (SD
13.0) Mean Education 12.64 (SD 2.13)
Gender Male (n 159) Female (n 242)
Participants were excluded if they self-
reported any history of psychiatric or
neurological disorders. MEASURES The
Vocabulary subtest consists of 40 items in
which the client picks the best synonym from 4
choices. The Abstraction subtests consists of
20 items that requires the client to complete
a logical sequence of numbers, letters, or
words. A smaller sample of 127 participants
were also administered the verbal subtests of
the WAIS-III. All measures were
administered according to standardised
instructions. RESULTS Reliability
(a-coefficients) Scales Vocabulary (? .79)
Abstraction (? .79), Total ? .83 ?
indicates good internal consistency Influence of
Demographic Variables Age divided into five age
groups (18-19, 20-29, 30-39, 40-49, 50).
Education divided into three groups (less than
12 years, 12 years, more than 12 years).
Analyses of Variance 2 (Sex) x 5 (Age) x 3
(Education) were conducted on the Vocabulary
and Abstraction subtest raw scores. For VOC,
significant main effects were found for both
age (F(4,373)25.20, plt.01) and education
(F(2,373)18.72, plt.01). Post Hoc comparisons
indicated that VOC norms were needed for lt 30
and ?30 years of age as well as ?12 yrs and
gt12 yrs of education. For ABS, a significant
main effect was found for education
(F(2,371)15.47, plt.01) which also
interacted significantly with age (F(8,371)
2.12, p .03). Post Hoc comparisons again
supported the reduction of age groups to two
but indicated the need for norms based on all
three educational levels. To maintain
consistency across the two subtests normative
tables were derived for VOC, ABS, and TOTAL
based on two age groups (18-29, 30-60) and
three education groups (Less than 12, 12,
more than 12 years). Normative data is
presented in Tables 1 through 3. All
normative data is standardised to Standard
Scores (m 100, s 15) rather than the
T-scores customarily associated with the
SILS. This was done to ? facilitate
comparison with other cognitive/
intellectual tests such as the Wechsler
batteries. ? minimise confusion with other
tests where T- scores are used in which
high scores reflect poor performance
(e.g. personality inventories).
RESULTS (contd.)
RESULTS (contd.)
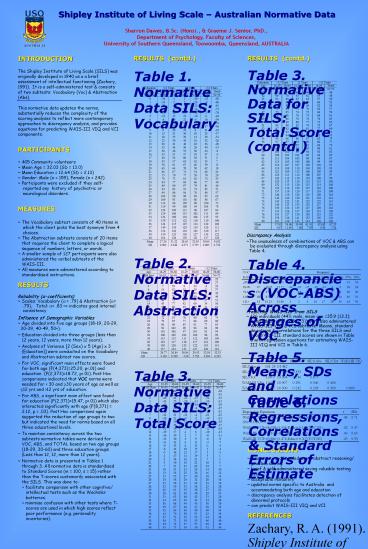
Table 1. Normative Data SILS Vocabulary
Table 3. Normative Data for SILS Total Score
(contd.)
Discrepancy Analysis The unusualness of
combinations of VOC ABS can be evaluated
through discrepancy analysis using Table 4.
Table 2. Normative Data SILS Abstraction
Table 4. Discrepancies (VOC-ABS) Across Ranges of
VOC
Predicting WAIS-III from SILS 126 individuals
(44 male, mean age 35.9 (13.3) mean
education 12.5 (2.3)) were also administered
WAIS-III VIQ VCI subtests. Means, standard
deviations correlations for the three SILS and
two WAIS-III standard scores are shown in
Table 5 with regression equations for
estimating WAIS- III VIQ and VCI in Table 6.
Table 5. Means, SDs and Correlations
Table 3. Normative Data SILS Total Score
Table 6. Regressions, Correlations Standard
Errors of Estimate
CONCLUSIONS
measures word knowledge and abstract reasoning/
problem solving brief self-administered
saving valuable testing time acceptable
reliability updated norms specific to Australia
and accommodating both age and education
discrepancy analysis facilitates detection of
abnormal protocols can predict WAIS-III VIQ and
VCI
REFERENCES Zachary, R. A. (1991). Shipley
Institute of Living Scale Revised Manual. Los
Angeles Western psychological Services.
Recommended
CrystalGraphics Presentations


