
Analysis Techniques for Rotating Machinery - PowerPoint PPT Presentation
1 / 31
Title:
Analysis Techniques for Rotating Machinery
Description:
tachometers for one or more shafts. phase-assigned autospectrum for ... Speed values from Tachometer. Average speed values from Analyzer(s) Time. Tags. Speed 1 ... – PowerPoint PPT presentation
Number of Views:516
Avg rating:3.0/5.0
Title: Analysis Techniques for Rotating Machinery
1
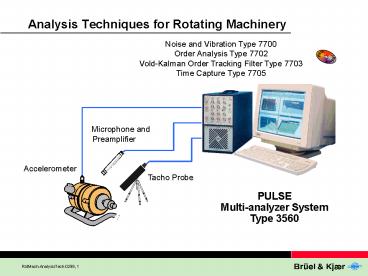
Analysis Techniques for Rotating Machinery
Noise and Vibration Type 7700 Order Analysis Type
7702 Vold-Kalman Order Tracking Filter Type
7703 Time Capture Type 7705
Microphone and Preamplifier
Accelerometer
Tacho Probe
PULSE Multi-analyzer System Type 3560
2
Outline
- Multi-analysis for rotating machinery analysis
- Analysis techniques for diagnosis in steady
state condition - Analysis techniques for non-stationary signals
- run-up/down tests
- transient phenomena
3
PULSEThe new PC based analyzer platform from
Brüel Kjær
- High performance Digital Signal Processing HW
SW allowing for Multi-analysis of Multichannels
A system consisting of Front-end PC with DSP
MS-Windows NT
Front-end modules
DSP board(s)
Application software LabShop Tool Packs
- Real-time Analysis using one or more analyzers in
parallel
- Setup Graphics
- Post-processing
- Reporting
- based on MS-Windows NT
- Signal conditioning
- Signal generation
4
What is Multi-analysis ?
Simultaneous multiple analyses of same physical
input
- FFT analysis (narrowband analysis)
- CPB, Digital Filtering (1/n octave analysis)
- Overall analysis (Overall Level Meters)
- Tachometers (Speed, RPM)
- Order Tracking analysis
- Time domain analysis
- Vold-Kalman Order Tracking Filtering
- Zwicker-Loudness analysis
- Data Recorder (throughput to Disk)
- - - - -
5
Channels, Signals and Signal Groups
Channels
Signals
Signal Groups
Tacho 1 Reference
Tacho Reference
1
(2 kHz)
Foundation left
2
(2 kHz)
Vibration Response
3
Foundation right
Bearing for vibration
Bearing
4
Bearing for acoustics
(20 kHz)
Bearing for Acoustics
Motor
1
Noise Upper Position
Acoustic Response
(20 kHz)
Noise Mid Position
2
Foundation
3
Noise Lower Position
Signal 8
4
6
Rotating Machinery Analysis
- Analysis tools for diagnosis in steady state
condition - high resolution FFT using zoom or large
transforms - time capture for high resolution
- order tracking for machines with varying speed
- signal enhancement, also combined with order
tracking - tachometers for one or more shafts
- phase-assigned autospectrum for ODS, balancing
etc. - data export to modal programs for ODS animation
etc. - cepstrum of weighted spectrum for identification
of harmonic- and sideband-families - orbit plot (time x versus time y)
7
High Resolution spectrum based on large Fourier
Transform
Identification of narrow spaced components over a
wide frequency span
- 6400 line Fourier Spectrum
- (? f 62.5mHz
- span 400Hz)
Detailed view around the fundamental rotational
frequencies (Display of 240 lines out of the 6400
lines)
8
Analysis without and with Tracking
a) Original signal
Time
b) Fixed sampling frequency
Spectrum without tracking
fs 2,56 ? fmax
Samples analysed
fmax
Time
Frequency
c) Sampling according to frequency variation
Spectrum with tracking
Example fs 8 ? ffundamental
Samples analysed
4
3
2
1
Orders
Revolutions (periods)
810110/1
9
Analysis without and with Tracking
Analysis of a vibration signal from a machine
with varying speed
Without tracking
With tracking
10
Signal Enhancement combined with Order Tracking
FFT without signal enhancement Time
Frequency Spectrum
- Signal Enhancement and Order Tracking
- Time Enhanced Time Enhanced Order
Spectrum
11
Cepstrum for identification of harmonic- and
sideband- families
- Frequency spectrum
Cepstrum
12
Rotating Machinery Analysis
- Analysis tools for run-up/down tests
- FFT with short time records (few no. of lines)
- order tracking for
- a) avoiding smearing
- b) wide RPM, order ranges
- time capture for fast run-ups/downs using Short
Time Fourier Transform (STFT) - speed tags from one or more tacho signals
- more independent multibuffers for f.ex run-up and
run-down in the same measurement session - Vold-Kalman Order Tracking Filter
13
Calculation of Slices and Average Speeds in the
Analyzer
Tachometer
To Multibuffer
Instantaneous Speeds
Tacho signals
Speeds
Analyzer
Instantaneous Spectra
Averaging
Response Signals
Spectra
Slices
Slices
Average Speed in record
Averaging
Average Speeds
A Slice is an order or a frequency band stored as
a function of RPM/time
14
Storage in Multi-buffers(storage based upon
speed interval, time,..)
- Four multi-buffers with individual setup
- Separate analysis of run-up and run-down in a
single test - Spectra
- Slices (order, frequency band)
- Speed values from Tachometer
- Average speed values from Analyzer(s)
- Time
FFT, Order, 1/3 oct. Spectra
Order, Freq.Band Overall Slices
Tags
15
Run-up/down Tests without Tracking
Contour plot of frequency spectra versus RPM
Harmonic orders extracted by delta cursor
16
Coast-down test - Before After Repair
- Waterfall plots before and after repair
- Notice changes in the 2nd and 4th orders due to
misalignment
17
Run-up/down Tests with Tracking
Contour plot of order spectra versus RPM
Harmonic orders extracted by harmonic cursor
18
Run-up Tests using Time Capture and STFT
- Use Time Capture Analyzer to capture the signals
- example Run-up of small electrical motor
- Select the part of the time signal to be analysed
- Short Time Fourier Transform (STFT)
- for overview and inspection
- dominating ordersnos. 1, 3, 9 and 10
19
Tacho Signal and RPM profiles from Time Capture
- Tacho signal (expanded)
- RPM Detection example
- level 30, slope , hysteresis 5
- 15 segments, 0 rejection, no Hinge Points
- RPM profiles
- Raw estimate
- Curvefitted results
- Step by step procedure
- data recording and selection
- use conventional analysis techniques first, e.g.
STFT - compare raw and processed RPM profiles
20
Output from a Vold-Kalman analysis from Time
Capture
- Phase assigned orders
- Formats available real, imag, mag, phase,
nyquist - Magnitude of the 4 selected orders is shown
- Order waveform
- 1. and 3. orders are shown
- Playback via Sound Board
21
Time Capture of fast run-up of spin drier
- Triaxial acceleration response
- Tacho signal recorded in parallel
22
Short Time Fourier Transform of fast run-up of
spin drier
- Short Time Fourier Transform (STFT) of fast spin
drier run-up - span 800Hz
- 200 lines, ? f 4Hz
- Radial response
- 1st and 22th order dominating
23
Vold-Kalman filtering of fast run-up of spin drier
- RPM as a function of time
- RPM profile
1st order of the triaxial response (extracted
using 2-pole 50 bandwidth filter)
24
Rotating Machinery Analysis
- Tacho analysis for steady state and run-up/down
- speed of one or more shafts
- tacho detection, hold off, divider, averager
- gearing as ratios and/or factors
- tacho treated as signal, i.e. can be used as a
phase reference
25
Tachometer Output
Tacho inputs
- Speed
- Use
- Speedometer
- Speed trigger
- Speed interval trigger
Tacho- meter
- Trigger
- Use
- Start of FFT record
- Syncronous analysis
- Tracking Reference
- Use
- Order Analyzer
Accuracy!!
Frequency Analysis Reference is sec
Order Tracking Reference is rev
26
Tacho Signal Setup Parameters
Slope of tacho signal (positive or negative)
Hysteresis as of max. input for e.g.,
removing ringing
Tacho signal trigger level as of max. input
Hold-off as of distance between last 2
successive pulses
Hold-off in seconds from last trigger
Tacho averager for suppression of tacho period
jitter
Divider for removing non-equidistant pulses
- Ratio between tacho
- frequency and
- rotational frequency
- (gear train ratio) can
- be set as
- Ratio (gearing)
- Factor (encoder)
- Combination
Up to four fractions for gear ratios, etc.
Factor between tacho and rotational freq.
27
Tacho Detection
V
Tacho Input DC-coupled!
Input Max
Hysteresis
V
Trig level
?
?
?
?
Level
Time
Time
AC
Speed dependent tacho signal e.g. magnetic
induction
Slope
V
?
?
V
?
Time
x sec
Time
V
y
?
Max 45 during run-up
Time
28
Tacho Divider
X
Z
Y
Z
Y
X
X
Y
Z
Divider 3
1 rev
NB Not to be used for gearing!
29
Tacho Pulse Averager
Averager 5
Linear average of 5 previous periods.
NB Endangers tracking of high speed variation!
30
Tacho Gearing
Ratio
Factor
12
A
A
B
N pulses / rev
Probe
Probe
Factor N
Combined gearing Ratio ? N
31
Conclusion
PULSE provides a complete range of tools for
multichannel rotating machinery analysis and
diagnostics. Multi-analysis is simultaneous
multiple analyses of multichannels using
different instrumentsor variants of the same
instrument
- Advantages of Multi-analysis
- reduced test/analysis time
- different diagnostic analyses at the same time
- ensures consistency of data
Recommended
CrystalGraphics Presentations


