
Effects of Variability in Hydrographic Structures on Biological Activity - PowerPoint PPT Presentation
1 / 1
Title:
Effects of Variability in Hydrographic Structures on Biological Activity
Description:
in Bering Strait over Four Years ... In Bering Strait, stations 1 to 3, which lie closest to Little Diomede Island, ... Bering Strait is the important conduit ... – PowerPoint PPT presentation
Number of Views:43
Avg rating:3.0/5.0
Title: Effects of Variability in Hydrographic Structures on Biological Activity
1
Effects of Variability in Hydrographic Structures
on Biological Activity in Bering Strait over
Four Years Sang H. Lee and Terry E. Whitledge,
School of Fisheries and Ocean Sciences,
University of Alaska Fairbanks
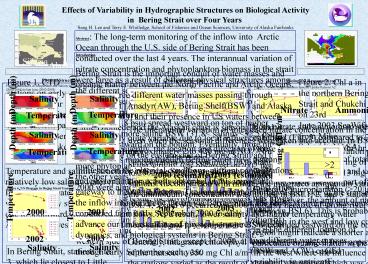
Abstract The long-term monitoring of the inflow
into Arctic Ocean through the U.S. side of
Bering Strait has been conducted over the last 4
years. The interannual variation of nitrate
concentration and phytoplankton biomass in the
strait were large as a result of different
physical structures among the different seasons
and years. For example, the physical structure
observed in 2002 was unusual due to southward
wind and current flows. As a result, low salinity
water ACW (salinity lt31.8 psu) spread westward on
top of higher nutrient and more saline BSW (31.8lt
salinitylt32.5 psu) extended eastward on the
bottom. Eventually, more nitrate was available on
the eastern side of Bering Strait and thus more
phytoplankton activity was observed in 2002 than
in the other years. In contrast to that, nitrate
concentrations in 2000 were almost depleted when
ACW occupied most of the strait and, as a result,
the phytoplankton biomass was lowest for the 4
yearly-observation periods.From this limited
spatial sampling it appears that the overall
fertilization of BSW maintained enhanced
biological conditions in the western side of
Bering Strait, except in 2000, at least through
early September each year.
Introduction Bering Strait is the important
conduit of water masses and organic matter
between the North Pacific and Arctic Oceans.
There are three different water masses passing
through Bering Strait Anadyr(AW), Bering
Shelf(BSW) and Alaska Coastal(ACW) and their
presence in US waters between Little Diomede and
the Alaskan coast is seasonally and
inter-annually quite variable due to local
influences of the wind. Consequently, the
location and direction of these water masses
moving through Bering Strait have a strong
influence on the physical conditions, nutrient
concentrations and phytoplankton activity
observed in this important gateway to the Arctic
Ocean. The long-term monitoring of the inflow
into the Arctic Ocean via Bering Strait has been
conducted from early September 2000 to early July
2003 to advance our understanding of physical
structures, nutrient dynamics, and biological
systems in Bering Strait.
A2
Physical Structures
Nutrient Responses
Biological Responses (cont)
Figure3. Structures of Temperature and Salinity
in Bering Strait from early September
(2000-2001) to late June (2002-2003)
Figure 5. Integrated Nitrate and Ammonium in BSL
Figure 7. Nitrate and Ammonium Specific Uptake
Rates in A2
Both nitrate and ammonium specific uptake rate at
station A2 were higher in 2002 when both
nutrients were enhanced (Fig. 5) compared to
2003. As a result, the vertically integrated
nitrate and ammonium uptake in 2002 were 1.96
and 1.95 mg N/m2 hr, respectively which were
higher than 0.66 and 1.05 mg N/m2 hr in 2003. The
percent of nitrate uptake of total nitrogen
uptake (nitrate ammonium) was also higher in
2002 (50.2 ) than in 2003 (38.7 ).
Figure 8. Size Fractionation of Chlorophyll in
Surface of Bering Strait (2003)
Salinity
mg Chl a/m2
Biological Responses
Figure 6. The vertical integrated chlorophyll
biomass in BSL
Temperature and salinity structures in Bering
Strait were different among the different seasons
and years. In 2000, relatively low salinity
water (lt31.8 psu), believed to be ACW, occupied
in the whole western part of US Bering Strait
water. In 2001 and 2003, salinity was somewhat
higher in the western side of the transect and
there was a relatively strong front in the
middle of the transect. In contrast, the physical
structure was unusual in 2002 due to southward
wind and current flows. As a result, lower
salinity and higher temperature water ACW spread
westward on top of more saline and low
temperature BSW extended eastward on the bottom.
2001 (estimated)
2000 (estimated)
Figure 4. T/S Diagram in Bering Strait Transect
mg Chl a/m2
2000
2001
Conclusions gt The different location of two
different water masses (BSW and ACW) caused
variability in nutrients concentrations and hence
phytoplankton biomass in Bering Strait. gt The
overall fertilization of BSW enhanced nutrients
and phytoplankton biomass in the western US side
of Bering Strait (except in 2000) in summer until
at least early September even though there were
differences that reflect variable growth
conditions of the phytoplankton in each of the
years. gt Relatively large phytoplankton (gt 20
µm) were dominant (54 - 97 ) in Bering Strait
and possibly in the southern Chukchi sea. This
might indicate a shorter and more efficient food
chain in these regions.
2003
2002
Generally, integrated chlorophyll concentration
ranged from approximately less than 50 mg Chl
a/m2 at the eastern end of the transect to 350 mg
Chl a/m2 in the west where the influence of
Anadyr water is felt. However, the chlorophyll
at the stations varied as the result of chemical
abundance which was driven by the physical
processes in the region. In 2002 when BSW
extended farther over the western end of the
transect, more nitrate was available on the
Bering Strait line (Fig.5) and thus more
phytoplankton was observed than in the other
years. In contrast to that, when ACW occupied
in water column of BSL in 2000, integrated
nitrate concentration was very low and
subsequently low chlorophyll occurred at all
stations of the transect. Overall, the
fertilization of BSW enhanced nutrients and
chlorophyll biomass in the western side of
Bering Strait, except in 2000, at least through
early September.
In Bering Strait, stations 1 to 3, which lie
closest to Little Diomede Island, showed the
highest salinities (31.44 lt lt32.63 psu) with low
variability while stations 5 and 6 near the
Alaska coast fell in the range of lowest
salinities (up to 23.03 psu) with high
variability seasonally and interannually
primarily due to the freshwater discharge. T-S
curves in 2002 showed the most characteristic
feature of the hook shape of the deeper layers in
intermediate stations (BSL2,3, and 4). This T-S
pattern is predominantly due to layering as shown
in Fig. 3.
Acknowledgements We would like to thank the crew
members of the R/V Alpha Helix. We are also
grateful to Dr. Rebecca Woodgate and Sarah
Thornton for help with sampling and the CTD data.
This was funded by NSF-OPP-0125082.