
Multivariate Techniques - PowerPoint PPT Presentation
1 / 12
Title:
Multivariate Techniques
Description:
Scree test criterion. FACTOR LOADINGS: Factor loading(s) above 0.3 are considered significant. ... Scree Plot. From: Hair et al. Graduate Statistics Workshop 8 ... – PowerPoint PPT presentation
Number of Views:213
Avg rating:3.0/5.0
Title: Multivariate Techniques
1
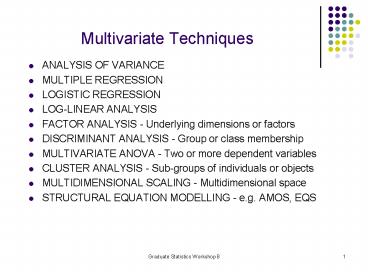
Multivariate Techniques
- ANALYSIS OF VARIANCE
- MULTIPLE REGRESSION
- LOGISTIC REGRESSION
- LOG-LINEAR ANALYSIS
- FACTOR ANALYSIS - Underlying dimensions or
factors - DISCRIMINANT ANALYSIS - Group or class membership
- MULTIVARIATE ANOVA - Two or more dependent
variables - CLUSTER ANALYSIS - Sub-groups of individuals or
objects - MULTIDIMENSIONAL SCALING - Multidimensional space
- STRUCTURAL EQUATION MODELLING - e.g. AMOS, EQS
2
Factor Analysis
- Purpose Data reduction and summarisation
- in terms of underlying dimensions or
factors. - R factor analysis
- Identify factors from variables
- Q factor analysis
- Combine subjects into groups.
3
R Factor Analysis Example.
- Subjects are tested on 4 different types of IQ
test. - Can the four scores be described by fewer than
four - underlying factors/dimensions?
- Consider two underlying dimensions
- Score1 ß1Factor1 ß2Factor2
- Factor1 ß3score1 ß4score2 ß5score3
ß6score4 - Factor2 ß7score1 ß8score2 ß9score3
ß10score4
4
Correlation Matrix
TEST1 TEST2 TEST3
TEST4 TEST1 1.00000 TEST2
0.29359 1.00000 TEST3 -0.82413
-0.16388 1.00000 TEST4 0.02756
-0.42735 -0.09452 1.00000 correlation
is statistically significant at p0.01 level
5
Interpretation of Factors
NUMBER OF FACTORS Latent root factor -
Eigenvalue. Scree test criterion. FACTOR
LOADINGS Factor loading(s) above 0.3 are
considered significant. Take into account the
size of the sample, as with correlation
coefficients. How to interpret the data.
6
Eigenvalues
Factor Eigenvalue Pct of Var Cum Pct 1
1.94110 48.5 48.5 2
1.38318 34.6 83.1 3 .51081
12.8 95.9 4 .16492
4.1 100.0
7
Scree Plot
From Hair et al
8
Factor/Component Matrix(Factor Loadings)
9
Factor/Component Scores
Factor1 0.483Test1 0.256Test2 - 0.462Test3 -
0.056Test4 (N.B. Using standardized score
on each variable)
10
Factor Rotation Methods
- VARIMAX - each factor loads high on some
variables and - low on others (Orthogonal Factor Rotation).
- QUARTIMAX - variable loads high on one factor
and - low on all others (Orthogonal Factor
Rotation). - EQUIMAX - compromise between varimax and
quartimax (Orthogonal Factor Rotation). - DIRECT OBLIMIN, PROMAX Higher eigenvalues
but more difficult to interpret (Oblique
Factor Rotation).
11
Orthogonal Factor Rotation (e.g. Varimax,
Quartimax)
From Hair et al
12
Oblique Factor Rotation(e.g. Direct oblimin
rotation, Promax rotation )
From Hair et al
Recommended
CrystalGraphics Presentations


