
Forecasting in the Justice System - PowerPoint PPT Presentation
1 / 47
Title:
Forecasting in the Justice System
Description:
Victorian Prison Projections Modelling circa 1982. Problems with Regression approach led to attempts ... Recidivism and management of high-rate offenders. All ... – PowerPoint PPT presentation
Number of Views:51
Avg rating:3.0/5.0
Title: Forecasting in the Justice System
1
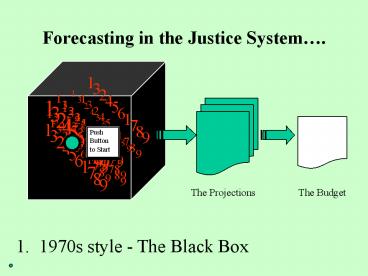
Forecasting in the Justice System.
Push Button to Start
The Projections
The Budget
1. 1970s style - The Black Box
2
Example Victorian Prison Projections Modelling
circa 1982.
Problems with Regression approach led to attempts
at simulation modelling
3
What Drives the Criminal Justice System?
- A. Peter Harmsworth
- or
- Demographics and Offending.
- Social, Economic Technological Change.
- Justice, Politics, and Significant Events.
4
The Important Things - 1. Demographics of
Offending
Traditional Property Crime
Rates of Arrest
Violent Crime
Sophisticated Property Crime
10yrs
80yrs
Age of Offender
5
The Important Things - 2. Social, Economic
Technological Factors
6
(No Transcript)
7
The Important Things 4 Significant Events - an
Example
60000
Prisoners in England Wales 1986-1996
Conference legislative proposals
Home Sec Speech. Prison Camp Openings
Start of Bail Information Schemes Increased use
of Bail Hostels
Prisoners
Police Bail Campaign
Criminal Justice Act 1993
50000
White Paper
Criminal Justice Public Order Act 1994
Criminal Justice Act 1988
Introduction of Half Remission
Criminal Justice Act 1991
Home Secretarys 27 point speech
Bulger murder
40000
1986 1987 1988 1989
1990 1991 1992
1993 1994 1995 1996
8
Australia 1945-98
Whitlam Labor Government 1972-75 Human rights
report on prison conditions Extension of
Probation scheme.
Hawke/Keating Labor Gov't. 1983-96 Creation of
Community Service scheme.
Homicide Deaths per 100,000
All major political parties campaigning on "get
tough" policies.
Fraser Coalition Government 1975-83 and swing to
right at State level.
Prison rates low during wartime
Shift to right at State level Disillusion with
community based options.
Political Index definition Prior to 1980
Coalition scores2 for Federal, 1 for NSW, Vic
and Qld Labor scores -2, for Federal, -1 for
NSW, Vic Qld. Then annual drift to political
right, so by 1998 Coalition scores4 for
Federal, 3 for NSW, Vic and Qld Labor scores
2, for Federal, 1 for NSW, Vic Qld.
The Important things - 5. Prison Trends reflect
Political Change
9
Findings 1Crime rate drivers demography
10
Findings 2Crime rate drivers family and
societal issues
11
Findings 3Crime rate drivers economic factors
12
Findings 4Crime rate drivers illicit drug
factors
13
Findings 5Crime rate drivers systemic factors
- 1
14
Findings 6Crime rate drivers systemic factors
- 2
15
Evidence-based planning for the future
Conclusions so far.
- Black box (regression models) approach cant
work, because - except in the short-term - the
future will not be like the past - A deep understanding of the present is needed to
inform about the future - Age-profiles are the most consistent predictors
of crime, but are themselves dependent on a wide
range of factors - Expert (insider) knowledge is essential for
other factors, including social, technological,
economic and political change - Some things just cant be predicted
Recent Trend Data
Interactions Modelling capability
Expert Knowledge of the Environment
16
These findings support the philosophy of
Victorian Prison Projections Modelling since
circa 1994
Data informs expert workshop
Workshop on trends in society, offending,
policing, sentencing and release policies.
Workshop informs projection model
17
Workshop Format
- Expert knowledge - trends in society, offending,
policing, sentencing and release policies. - Invitees include policy and research staff from
across CJS, plus wide range of academics and
other external stakeholders. Aim for consensus,
but accommodate divergence. - Creates ownership of projections - (and shares
blame!). The REAL projections.
Receptions - quantify changes in age-specific
rates
Times to Serve - quantify changes in percentages
18
Recent Victorian Prison Trends
19
Trends in Total Male Prisoner Numbers 1990/91 -
1999/2000
20
Trends in Male Remand Prisoner Numbers 1990/91 -
1999/2000
21
Annual Cycles - Male Prisoners 1990/91 - 1999/2000
22
Police Cell Trends
23
ABS Demographic Projections for Victoria 1997 -
2031
24
Base Run Projections of Prisoner Receptions, by
Sex and MSO
25
Base Run Projections of Prisoner Populations, by
Sex and MSO
26
Base Run 20 year projections Male PrisonersTotal
Receptions and Prison Populations
27
Base Run next five years Total Male and Total
Female Prisoners with variance limits
28
Workshopped Scenarios
Males Assaults, Robberies - no change in
receptions more breaches - in good order
category. Sex offences - 5 increase in
receptions 25 longer sentences Burglary -
receptions up between 0-5, then diversion for
two years, then breaches 5. Drug offences -
receptions up 0-10. Good Order - receptions up
20. Homicides, Fraud, Other property, Driving
offences - no change. Females Assaults - no
change in receptions more breaches - in good
order. 10 longer sentences. Sex offences - 5
increase in receptions 25 longer
sentences Robbery - receptions up 5. Sentences
unchanged. Burglary - receptions up between
0-5, then diversion for two years, then breaches
5. Drug offences - receptions up 0-10 for
minor offences, 25 for major offences. Good
Order - receptions up 20 after 2 yrs. Sentences
10 longer after two years. Homicide, Fraud,
Other property, Driving offences - no change.
29
Entering Scenarios
30
Scenario next five years Total Male and Total
Female Prisoners with variance limits
31
Extending this approach across the Victorian CJS
Reports April
Futures Research Strategic Planning Workshop 20
year horizon
May - feeds into Business unit planning cycle
June/July (end-of-yr stats)
Workshop on trends in sentencing/release
policies. 3-5-10yr horizon
Workshop on trends in society, offending,
policing. 3- 5-10yr horizon
August
Persons Arrested
Sentences Imposed
September
Prison projection
October - feeds into ERC1
32
Model SchemaThis new model describes the
process from Recorded Crimes to Sentencing
33
Model Inputs Outputs
34
Robbery age distribution of arrests 1996-2000,
projected to 2005
35
Residential burglary age distribution of
arrests 1996-2000 , projected to 2005
36
Major Drug Offences age distribution of arrests
1996-2000, projected to 2005
37
Minor Drug Offences age distribution of arrests
1996-2000, projected to 2005
38
Capable of Modelling Complex Scenarios
- 1. Generation Shift
- in line with the expectations of the futures
research, trends revealed in the crime
statistics, likely changes in police resource
allocation and possible results from diversionary
treatments for drug offenders - Robbery rates increase over next 5yrs
- Burglary rates decrease for under 20yos,
increase for 20yo/s - Drug offence arrests decrease
- 2. Policy Response Testing
- test the effects of South Australian style
regulatory enforcement of recreational drug usage
commencing in 2004 - Arrests for drug possession to decrease by 90
after 2003 - Outcomes for remaining drug possession charges
mainly fines - Arrests for drug trafficking etc to decrease by
40 after 2003 - Outcomes for remaining trafficking charges mainly
CBO/fines
39
Entering Crime Trend Scenarios into the model
- Model works on rates of recorded crime. Rates
can be linked to reporting rates or to
age-specific arrest rates. - Demographic projections are built-in, so changes
in crime levels that are demography-related are
automatic. - Five Methods used to project rates of recorded
crime, by type of offence - 1. Regression model, where driver variable(s)
are known and reliable for the specific offence
type - autoregressions key age groups. - 2. Correlation model, where crime rates correlate
with total population. - 3. Time series trendline extrapolation, where
driver variables are uncertain but trendline
appears reliable for the specific offence type - 4. Age-specific arrest-rate adjustment, where
age-related scenarios are involved - 5. If all else fails, User-defined rates (pluck
trends in crime rates out of the air).
40
Choosing your trend model
41
Changes in reporting Rates
42
Age-specific arrest-rate adjustment
43
Sentence Type Adjustment
44
Model Outputs
45
Potential for Evidence-based planning throughout
Joined-up Government
JJ Model informs offending and sentencing
components of CJS model
Juvenile Justice Model
Health Model informs drugs and other components
of CJS model
Health Model
CJS Model
Infrastructure Model informs offending components
of CJS model
CJS Model informs components of other models
Infrastructure Model
Other relevant organisations
46
Victorian Juvenile Justice Model
47
And finally.
Recommended
CrystalGraphics Presentations


