
Bioinformatics Course Outline - PowerPoint PPT Presentation
1 / 54
Title:
Bioinformatics Course Outline
Description:
Gene prediction and promoter analysis, sequence assembly and primer design. 4 ... Homologues: Orthology vs Paralogy. Reproduced from NCBI education website. Intro. ... – PowerPoint PPT presentation
Number of Views:234
Avg rating:3.0/5.0
Title: Bioinformatics Course Outline
1
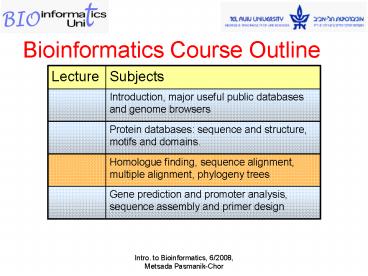
Bioinformatics Course Outline
2
Terms
Homology Sequences that are related by
divergence from a common ancestor. Identity Seq
uences that are invariant. Similarity Sequences
that are related.
C A T C A T
C A G C A T
3
Homologues Orthology vs Paralogy
Reproduced from NCBI education website
4
Why DO Homologies ?
- A powerful tool to? compare newly discovered
sequences - with known genes.
- Both functional, structural and evolutionary
information - can be inferred.
- Regions of similarity in unrelated proteins may
be detected. - Re-construct long DNA sequences from short
overlapping - fragments.
- Explore frequently appearing patterns of
nucleotides - (homologous sequences, structure similarity, a
common - ancestor and similar function).
5
The Limits of Sequence Similarity
6
How Do We Measure Sequence Alignment ?
T C A T G C A T T G
or
T C A T G C A T T G
T C A T G C A T T G
?
7
Most Common Mutation Types
insertion (in) AGCGGC deletion (del)
ACG_C ACGGC substitution (sub) CCGGC
(INDEL insertions deletions)
8
Similarity Score of Alignment
- Each pair of characters in the alignment gets
a value, - depending on its identity.
- The similarity score of the alignment is the
sum of - pair values.
- Example for pair values (relevant to DNA)
- Identical characters (match) 1
- Different characters (mismatch) -1
- Indel (gap) -1
9
Example for Similarity Scores
Score -1 0 -4
S AC_TG
T A_GT_
S ACTG
T AGT_
S
ACTG
T _AGT
S ACTG T AGT
S, T is the best of these three,
but is it the best of ALL alignments ???
10
Algorithms Heuristics
- There are a number of exact algorithms and
heuristics - for finding alignment(s)
- Exact algorithm guarantees to find the best.
- Heuristics usually find the best or almost the
best. - Bottom line Heuristics are typically much faster
but do not guarantee to find best homologues
(time vs. quality trade-off).
11
Pair-wise Alignment Programs
- Exact Algorithms
- Based on dynamic programming, a known
- algorithmic tool (not exhaustive search !).
- Most sensitive, but computational expensive
and slow - Heuristics, based on SW algorithm
- 1. FASTA (1985) (http//www2.ebi.ac.uk/
fasta3/) - 2. BLAST (1990) (http//www.ncbi.nlm.n
ih.gov/BLAST/)
- Needlman-Wunch (1970).
- Smith-Waterman (SW 1981).
http//rna.informatics.indiana.edu/wtclark/sw.html
http//bioweb.pasteur.fr/seqanal/interfaces/wate
r.html
12
Example for Gap Penalties
(Improved Pricing of InDels)
Motivation Aligning cDNAs to Genomic DNA
Example
Genomic DNA
In this case, if we penalize every single gap by
-1, the similarity score will be very low, and
the parent DNA will not be picked up.
13
Types of Gap Penalties
- (insertions or deletions, indels)
- Insertions and deletions are rare in
evolution. - Once they are created, they are easy to
extend. - Examples
- BLAST Cost to open a gap 10 (high penalty).
- Cost to extend a gap 0.5 (low
penalty).
FASTA
14
Sensitivity of Algorithm The ability to
recognize distantly related sequences. Selectivity
of Algorithm The ability to discard false
positive matches between un-related sequences.
How does word size influence sensitivity
selectivity ? Large word size - fast, less
sensitive, more selective distant
relatives do not have many runs of matches,
un-related sequences stand no chance to be
selected. Small word size - slow, more
sensitive, less selective.
15
Effect of Word Size
Large word size - fast, less sensitive, more
selective distant relatives do not have many
runs of matches, un-related sequences stand no
chance to be selected. Small word size - slow,
more sensitive, less selective. Example If
word size 3, we will find all words containing
TCG in this sequence (very sensitive compared to
large word size, but less selective and will find
all TCGs).
16
FASTA Visualization
Identify all hot spots longer than Ktup.
Ignore all short hot spots. The longest hot spot
is called init1.
Merge diagonal runs. Optimize using SW in a
narrow band. Best result is called
Extend hot spots to longer diagonal runs.
Longest diagonal run is initn.
opt.
17
Different Variants of Blast FastA
http//www-bioeng.ucsd.edu/research/research_group
s/compbio/workshop/
18
Lets Run FastA (FAST-All) Against EMBL
Nucleotide Sequence Database
http//www.ebi.ac.uk/fasta33/
http//www2.ebi.ac.uk/fasta3/help.html Example
and interpretation of results http//www.ebi.ac.u
k/2can/tutorials/nucleotide/fasta2.html
19
BLAST Tips http//www.ncbi.nlm.nih.gov/Education/
BLASTinfo/Blast_setup.html
http//blast.ncbi.nlm.nih.gov/Blast.cgi http//www
.ncbi.nlm.nih.gov/BLAST/about/ Step by step
BLAST http//www.ornl.gov/sci/techresources/Hum
an_Genome/posters/chromosome/blast.shtml
20
FASTA vs BLAST
- BLAST is faster than FASTA.
- Similar search strategy.
- Sensitivity-
- Protein searches BLAST and FASTA are
comparable. - Nucleotide searches FASTA is more sensitive.
- S-W is the most sensitive, but time consuming.
21
Blast A Family of Programs
- BlastN - nt versus nt database.
- BlastP - protein versus protein database.
- BlastX - translated nt versus protein database.
- tBlastN - protein versus translated nt database.
- tBlastX - translated nt versus translated nt
database.
Query DNA Protein Database DNA Protein
22
(No Transcript)
23
http//www.ncbi.nlm.nih.gov/BLAST/bl2seq/wblast2.c
gi
24
DNA or Protein
- DNA query can be translated and searched against
protein databases. - Translate all reading frames (3 3).
- Find long ORF (open reading frames).
- Protein query can be back-translated and searched
- against DNA databases.
- A protein sequence can be back translated to many
- possible DNA sequences, based on the codon
table. - During translation (DNA to protein) we loose
information.
25
Blink (BLAST Link)
BLink (BLAST Link) is a tool that displays the
pre-computed results of BLAST searches that have
been completed for every protein sequence in the
Entrez Proteins data domain.
BLink help http//www.cs.utk.edu/rcollins/bioin
f/tutorial/tutorial3.html
26
Scoring Systems for Protein Alignments
- Identity Count the number of identical matches,
divide by length of aligned region (in ). - Similarity A less well defined measure of how
close 2 sequences are. - Chemical similarities among amino acids
http//www.imb-jena.de/IMAGE_AA.html
27
Protein Scoring Matrices
- Family of matrices listing the likelihood of
changes from one sequence to another during
evolution. - The two most popular matrices are the PAM and the
BLOSUM matrices.
28
PAM Matrix - Point Accepted Mutations
PAM matrices are based on related sequences.
- In these related proteins, the
- function was not significantly changed.
The changes are accepted by natural selection
(mutations survived during evolution).
29
PAM Scoring Matrices
PAM units measure evolutionary distance.
PAM 1 matrix - Substitution scores arising from
sequences where one percent of amino acid
pairs are different. Note PAM 1 is a small
change -gt the sequences will be almost identical.
30
PAM Family of Matrices (Dayhoff, 78)
(log odds)
Note Numbers along diagonals are not all equal.
Values gt 0 in the logs odd PAM matrix indicate
likely mutations, values 0 are neutral and
values lt 0 indicate unlikely mutations.
31
THE BLOSUM Family of Matrices
Blocks Substitution Matrices- (BLOSUM
matrices based on a much larger dataset then PAM).
- Blocks are short conserved patterns of 3-60 aa
long. - Proteins can be divided into families by common
blocks. - Different BLOSUM matrices emerge by looking at
sequences with different identity
percentage.Example BLOSUM62 is derived from an
alignment of sequences that share at least 62
identity.
Block A B C D
32
THE BLOSUM Family of Matrices
Blocks Substitution Matrices
(log odds)
33
PAM vs. BLOSUM Matrices
Widely used
- Tips for protein similarity search
- Start with BLOSUM 62 or PAM 120, default gap
penalties. - If no significant results found, use BLOSUM 45
or PAM 250 - and lower gap penalties, to find more
divergent results. - Examine results above E-value 0.05 for
divergent sequences. - Use PSI-BLAST to discover weak but biologically
significant - sequence similarities.
http//www.ncbi.nlm.nih.gov/Education/BLASTinfo/Sc
oring2.html
34
From the BlastP Page Go To Taxonomy Report
Organism Report
Common name
Score
Blast (family) name
E-value
Scientific name
- TaxBLAST hits are sorted according to species
containing the target sequence. - All hits of the same organism are listed
together. - Within each species, TaxBLAST hits are sorted
by score and E-value. - See also Lineage report.
35
PSI-BLAST - Position Specific Iterated BLAST
- A fast heuristic method for searching a profile,
by using iterations. The profile is used as the
query in the next iteration. - Advantages of PSI-BLAST
- Identify week homologies (more distant
relatives of - a protein, not found directly in FASTA or
BLAST). - An important tool for predicting biochemical
function.
Information http//www.ncbi.nlm.nih.gov/Educatio
n/BLASTinfo/psi1.html
36
http//www.expasy.ch/prosite/
Prosite determines the function of
uncharacterized protein, and to which known
family of proteins it belongs. A pattern
describes a group of amino acids that constitutes
an usually short but characteristic motif within
a protein sequence.
For example The pattern AC - x - V - x(4) -
ED. is interpreted as Ala or Cys - any -
Val - any-any-any-any- any but Glu or Asp.
Note Search by full text.
37
PROSITE SYNTAX
For example The pattern AC - x - V - X(4) -
ED. is interpreted as Ala or Cys - any -
Val - any-any-any-any- any but Glu or Asp.
- The standard one-letter code for amino acids.
- x' any amino acid.
- ' residues allowed at the position.
- ' residues forbidden at the position.
- ( )' repetition of a pattern element are
indicated in parenthesis. - X(n) or X(n, m) to indicate the number or
range of repetition. - -' separates each pattern element.
- ' indicated a N-terminal restriction of
the pattern. - ' indicated a C-terminal restriction of
the pattern. - .' the period ends the pattern..
38
Prosite Patterns ....
- Consensus sequences and patters are regular
expressions, - that can be used like fingerprints. E.g.
PROSITE patters
-N-P-ST-P- PS00001
N-Glycosylation
MGENDPPAVEAPFSFRSLFGLDDLKISPVAPDADAVAAQILSLLPLKFFP
IIVIGIIALILALAIGLGIHFDCSGKYRCRSSFKCIELIARCDGVSDCKD
GEDEYRCVRVGGQNAVLQVFTAASWKTMCSDDWKGHYANVACAQLGFPSY
VSSDNLRVSSLEGQFREEFVSIDHLLPDDKVTALHHSVYVREGCASGHVV
TLQCTACGHRRGYSSRIVGGNMSLLSQWPWQASLQFQGYHLCGGSVITPL
WIITAAHCVYDLYLPKSWTIQVGLVSLLDNPAPSHLVEKIVYHSKYKPKR
LGNDIALMKLAGPLTFNEMIQPVCLPNSEENFPDGKVCWTSGWGATEDGA
GDASPVLNHAAVPLISNKICNHRDVYGGIISPSMLCAGYLTGGVDSCQGD
SGGPLVCQERRLWKLVGATSFGIGCAEVNKPGVYTRVTSFLDWIHEQMER
DLKT
39
Multiple Sequence Alignment Motivation
- Helps identify common structures and functions
- Build gene families.
- Shared homologous regions.
- Conserved regions (consensus).
- Serves as a basis for constructing phylogeny
- (evolutionary) trees from homologous sequences.
40
Multiple Sequence Alignment using clustalw
http//www.ebi.ac.uk/Tools/clustalw/
41
Multiple Sequence Alignment using muscle
42
T-COFFEE Visualization of Multiple Alignment
http//www.ch.embnet.org/pages/services.html
http//www.ch.embnet.org/software/TCoffee.html
Results
More accurate program than ClustalW for sequences
with less than 30 identity, but it slower...
http//www.ch.embnet.org/software/ClustalW.html
43
Input Format for MSA (Fasta format)
gtworm
44
Readseq -- biosequence conversion tool
http//iubio.bio.indiana.edu/cgi-bin/readseq.cgi
45
BOXSHADE Visualization of Multiple Sequence
Alignment
Results
http//bioweb.pasteur.fr/seqanal/interfaces/boxsha
de-simple.html
46
Other Important Options Sequence Utilities
ReadSeq - converts nucleic acid/protein sequences
to FASTA format. RepeatMasker - identify and mask
repeats in DNA sequences. WebCutter -
restriction maps using enzymes w/ sites gt 6
bases. 6 Frame Translation - translates a
nucleic acid sequence in 6 frames. Reverse
Complement - reverse complements a nucleic acid
sequence. Reverse Sequence - reverses sequence
order (BCM).
http//searchlauncher.bcm.tmc.edu/seq-util/seq-uti
l.html
47
Phylogeny Reconstruction
Goal Given a set of taxa (a group of related
biological species), build a tree which best
represents the course of evolution for this set
over time.
48
Trees Rooted or Un-rooted
Most reconstruction methods produce un-rooted
trees. To root a tree we need external
information (e.g. out-group). Roots provide
direction to a tree and set ancestral states.
Un-rooted
Rooted
gorilla
chimpanzee
human
orangutan
chimpanzee
human
gorilla
orangutan
49
Tree Properties
Nodes External nodes (leaves) represent extant
(existing) species. Internal nodes represent
ancestral species (usually extinct). Branches
Length represent number of mutations. A longer
branch means more mutations, usually implying
longer evolutionary time. Typical time scale is
mya (millions years ago).
Root (the common ancestor of all taxa)
Internal nodes
Branch (length)
Another representation (A,B)(C(D(E,F)))
Time scale
chimpanzee
human
gorilla
orangutan
gibbon
siamang
Leaves
50
Number of Trees
The problem of optimal tree identification
becomes computationally hard if the algorithm
has to test every tree. In this case,
heuristics must be used.
rooted un-rooted Nodes
trees trees
51
PHYLIP Developed by J. Felsenstein, UOW
Phylogeny Inference Package
http//evolution.genetics.washington.edu/phylip.ht
ml
PHYLIP (the PHYLogeny Inference Package) is a
package of programs for inferring phylogenies
(evolutionary trees), available freely through
the internet.
http//bioweb.pasteur.fr/seqanal/phylogeny/phylip-
uk.html
52
Graphical Display of Resulting Trees in Phylip
DRAWGRAM - Plots rooted phylogenies,
cladograms, and phenograms.
gened.emc.maricopa.edu/.../BIOBK/BioBookDiversclas
s.html
DRAWTREE - Similar to DRAWGRAM but plots
un-rooted trees.
http//genomebiology.com/2001/2/6/research/0018
RETREE - The user can re-root, flip branches,
change names of species, change or remove branch
lengths.
http//bioweb.pasteur.fr
53
Phylodendron Phylogenetic tree printer
http//iubio.bio.indiana.edu/treeapp/treeprint-for
m.html (use example data).
54
Special Utilities
Splign is a utility for computing
cDNA-to-Genomic, or spliced sequence alignments)
global alignment algorithm).
http//www.ncbi.nlm.nih.gov/sutils/splign/splign.c
gi?textpageonlinelevelform
Specialized BLAST Choose a type of specialized
search (or database name in parentheses.) Search
trace archives Find conserved domains in your
sequence (cds) Find sequences with similar
conserved domain architecture (cdart) Search
sequences that have gene expression profiles
(GEO) Search immunoglobulins (IgBLAST) Search
for SNPs (snp) Screen sequence for vector
contamination (vecscreen) Align two sequences
using BLAST (bl2seq) http//www.ncbi.nlm.nih.gov/
BLAST/
Recommended
CrystalGraphics Presentations


