
Miravalles Unit 5: Performance Assessment Ron DiPippo, Consultant - PowerPoint PPT Presentation
1 / 37
Title:
Miravalles Unit 5: Performance Assessment Ron DiPippo, Consultant
Description:
Turbine Isentropic Efficiency. Miravalles Unit 5 Performance Assessment DiPippo & Moya ... Turbine Isentropic Efficiency. Based on H&MB specs ... – PowerPoint PPT presentation
Number of Views:75
Avg rating:3.0/5.0
Title: Miravalles Unit 5: Performance Assessment Ron DiPippo, Consultant
1
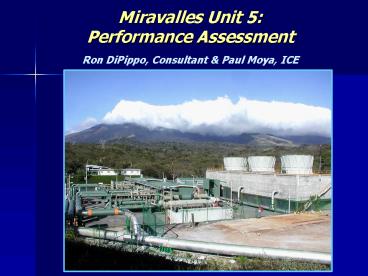
Miravalles Unit 5 Performance Assessment Ron
DiPippo, Consultant Paul Moya, ICE
2
Unit 5 Bottoming Binary Power PlantMiravalles
Field, Costa Rica
- Two Organic Energy Converters
- OEC-1 OEC-2
- Ormat supplied the equipment
- ICE installed operates the plant.
- Start-up in January 2004.
- Each module has two turbines driving one
generator. - Each module is rated at 7.75 MWe-net.
- Unit 5 thus is rated at 15.5 MWe-net.
- Total parasitic power is 2.1 MWe.
3
Layout of Each Module
Recuperators
Turbines
Generator
Condensers
Preheater
Condensers
Evaporators
Preheater
4
Unit 5 OEC-2 Piping Manifold
5
Pressure Enthalpy Cycle Diagram
6
Plant Efficiency Definitions
- THERMAL EFFICIENCY
- (First Law,
- energy based)
W is the turbine-generator output minus all
auxiliary power requirements Q is the rate of
heat added to the cycle working fluid from the
brine
7
Plant Efficiency Definitions
- UTILIZATION EFFICIENCY
- (Second Law,
- exergy-based)
W is the turbine-generator output minus all
auxiliary power requirements E is maximum amount
of exergy available in the incoming brine (the
rate of mass flow times the specific exergy of
the brine)
8
Plant Efficiency Definitions
- FUNCTIONAL EFFICIENCY
- (Second Law,
- exergy-based)
W is the turbine-generator output minus all
auxiliary power requirements E is the amount of
exergy contributed by the brine
9
Plant Efficiency Definitions
The difference between utilization efficiency and
functional efficiency lies in the denominator.
Utilization efficiency compares actual plant net
output to the absolute maximum permitted by the
Second Law functional efficiency compares it to
the maximum output allowed by the given brine
inlet and outlet states.
10
Plant Efficiency Definitions
- SPECIFIC BRINE CONSUMPTION
- (Site-specific,
- energy based)
SBC is less meaningful than the other efficiency
indicators, but is widely used in the industry
11
Plant Efficiency Definitions
- SPECIFIC BRINE CONSUMPTION
The value of SBC depends strongly on the brine
inlet and outlet temperatures, and thus cannot be
used to compare the performance of two different
plants, or even the same plant over time, if
these temperatures vary.
12
Exergy Definition
At plant site.
13
Exergy Definition
At plant site.
The thermodynamic dead state (state 0) is the
design wet-bulb temperature for the water cooling
tower, in this case 23.9C or 297.05 K.
14
Selected Binary Plant Thermal Efficiencies
- T, C Effic., Plant name and location
- 103 5.8 Amedee, CA
- 105 8 Wabuska, NV
- 109 7 Brady Bottoming Cycle, NV
- 122 10.6 Husavik Kalina, Iceland
- 130 12.9 Otake Binary, Japan
- 140 9.8 Nigorikawa, Japan
- 152 8.2 Steamboat SB-2 SB-3, NV
- 157 13.5 Ormesa II, CA
- 165 13.2 Heber SIGC, CA
15
Unit 5 Design ConditionsFrom Heat Mass Balance
Specs
16
Unit 5 Measured Performance Results for Each
ModuleTest date February 10, 2004
- OEC-1
- Heat input from brine ________ 53,227 kW
- Gross power ______________ 9,690 kW
- Gross thermal efficiency _____ 18.2
- Net thermal efficiency ______ 16.2
- OEC-2
- Heat input from brine ________ 54,360 kW
- Gross power ______________ 9,936 kW
- Gross thermal efficiency ______ 18.3
- Net thermal efficiency _______ 16.3
17
Unit 5 Measured Performance Results for Total
PlantTest date February 10, 2004
18
Unit 5
19
Maximum Binary Cycle Efficiency
20
Turbine Isentropic Efficiency
21
Turbine Isentropic Efficiency
Based on HMB specs
22
Unit 5 OEC-2 Performance Trends
Objective To determine the change in plant
performance from start-up in January/February
2004 to present (February 2006, at the time of
writing). Control room data logger provided
information on brine flow rates, brine
temperatures, brine pressures, and power
generation, on a daily basis. Some internal cycle
properties were also available, but not as many
as needed for a full cycle analysis. Brine data
was difficult to interpret owing to the sporadic
use of bypass valving in the inlet manifolds to
the heat exchangers.
23
Unit 5 OEC-2 Piping Manifold
24
Unit 5 OEC-2 Piping Manifold
25
Unit 5 OEC-2 Performance Trends
26
Unit 5 OEC-2 Performance Trends
27
Unit 5 OEC-2 Performance Trends
Performance drop-off over 2 years
Note All results are net.
28
Unit 5 OEC-2 Performance Trends
New tests were carried out in February 2006,
specifically to obtain reliable data on brine
flows and power generation. All bypass valves
were kept closed, including ones on the main
brine collectors that allow brine to bypass Unit
5 altogether. On three consecutive days,
measurements were made on the three brine
collectors C1 - supplying OEC-2, right side
C2 - supplying OEC-2, left side and C3 -
supplying OEC-1. Each of the tests was performed
for a period of three hours, during which the
measured quantities were essentially constant.
29
Unit 5 Performance Test Results Test dates
February 23-25, 2006
30
Unit 5 Performance Test Results Test dates
February 23-25, 2006
31
Unit 5 Performance Test Results Test dates
February 23-25, 2006
32
Unit 5 Performance Trends
WHY?
Note All results are net.
33
Changes in Unit 5 Brine Collector Flow Rates
Inlet Temperatures
34
Changes in Unit 5 Brine Collector Outlet
Temperatures
Conclusion The heat exchangers are now operating
far from their design conditions, resulting in
large departures of brine outlet temperatures
from their intended values.
35
Unit 5 Availability Capacity Factors
NOTE 1 Operating period is from January 1, 2004
through February 28, 2006, a total of 759 days.
There were 30 days when neither module was
operating. NOTE 2 Capacity factor based on 15.5
MW-net rated output.
36
Conclusions
Unit 5 demonstrated a net thermal efficiency in
excess of 16 at the start of operation. This is
higher than any other documented geothermal OEC.
Thermodynamic performance has declined over the
past two years, mainly due to departures from
design brine flow rates to the two modules. From
an operational standpoint, Unit 5 has performed
reliably, with good availability and a high
capacity factor. Lower than expected brine outlet
temperatures in two brine collectors are causing
concern in regard to reinjection and possible
scaling in pipelines and injection wells.
37
Thank you