
HYDROGRAPHY OF THE NAVO CENCAL REGION FOR DEC01 - PowerPoint PPT Presentation
1 / 18
Title:
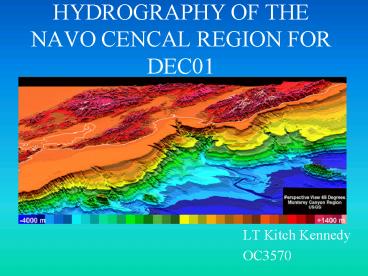
HYDROGRAPHY OF THE NAVO CENCAL REGION FOR DEC01
Description:
HYDROGRAPHY OF THE NAVO CENCAL REGION FOR DEC01. LT Kitch Kennedy. OC3570. What is hydrography ... hydrography is the branch of our field which looks ... – PowerPoint PPT presentation
Number of Views:79
Avg rating:3.0/5.0
Title: HYDROGRAPHY OF THE NAVO CENCAL REGION FOR DEC01
1
HYDROGRAPHY OF THE NAVO CENCAL REGION FOR DEC01
- LT Kitch Kennedy
- OC3570
2
What is hydrography
- Historically, the term hydrography has meant the
- scientific study of the physical conditions of
systems - of water. Within the field of physical
oceanography, - hydrography is the branch of our field which
looks - to understand the movements of the ocean through
- its measurable physical properties, including
- temperature, salinity, and oxygen, and chemical
- constituents.
- http//www.oce.orst.edu/po/hydro.html
3
Project Domain
4
Dynamic Topography
- General circulation through the entire layer of
the CCS. - California Current (CC)
- California Undercurrent (CUC)
- Davidson Current (CC)
- Dynamic through driving flow.
Contour - 0.02 dyn-m
5
Dynamic Topography
- Surface signature
- Meandering CC
- Weak Davidson current present.
- Strong onshore flow into Monterey Bay
Contour - 0.005 dyn-m
6
Dynamic Topography
- Heart of the CUC
- Product of large scale gradients
- Relatively strong poleward flow
- CC weakening
- Max depth 500m
Contour 0.003 dyn-m
7
Dynamic Topography
- Both CC and CUC still apparent
- Breakdown of dynamic trough
- Overall weakening currents
- Topography influencing CUC
Contour 0.003 dyn-m
8
Pressure fields on Sigma level
- Pressure btwn 50-80 dbar
- Dome of low pressure corresponds to dynamic
trough - CC and DC
Contour 4 dbar
9
Pressure fields on Sigma level
- Pressure btwn 90-150 dbar
- Stronger gradients stronger currents
- CUC influencing poleward flow along the coast
- Onshore flow building pressure max in Monterey Bay
Contour 5 dbar
10
Pressure fields on Sigma level
- Pressure 280-335 dbar
- More variability in the flow
- Core of the CUC
- Meander in CC not present at upper levels
Contour 5 dbar
11
Density vs. Salinity Curve
12
Surface Salinity
- Weak salinity gradient in the heart of the data
region - Fresh water signatures
- Mouth of San Francisco bay
- Pacific Sub-artic water
- Larger salinity gradient correlates well with
0/200 dynamic height contours
13
Salinity Analysis
- Fresh water run-off near SF Bay not evident
- Salinity max near coast
- Equatorial water advected north by DC and CUC
- Mixing of Sub-artic and Equatorial waters
- Strong gradient may represent the boundary of the
CC
Contour 0.03
14
Salinity Analysis
- CUC advection high salinity along the coast
- Relatively fresh pool created by subduction of
surrounding waters - CTD cast plots
Contour 0.02
15
Salinity Analysis
- Distinct boundary btwn water masses
- Stronger currents allowing less mixing
Contour 0.01
16
Sea Surface Temperature
- Poor indicator of current dynamics
- Warm water in region of dynamic trough
- Highly influenced by air-sea interactions
- Cooler water in vicinity of Monterey and San
Francisco Bays - Cold water intrusion from SW
Contour 0.2 degC
17
ADCP Data
- Qualitative comparison
- Strong correlation with 0/200 and 25.8 Sigma-lvl
pressure contours
18
QUESTIONS?
Recommended
CrystalGraphics Presentations


