
Overlay Analysis in GIS - PowerPoint PPT Presentation
1 / 21
Title:
Overlay Analysis in GIS
Description:
Biological and Environmental Engineering. Soil & Water Research Group ... Earth = geoid geodesists use spheroids or ellipsoids to model the 3-dimensional ... – PowerPoint PPT presentation
Number of Views:3709
Avg rating:3.0/5.0
Title: Overlay Analysis in GIS
1
Overlay Analysis in GIS
2
- Vector overlay analysis
- Raster overlay analysis
Outline
3
Vector overlay analysis
- Dissolve Aggregates features that have the same
value for an attribute that you specify.
(polygons) - Merge Appends the features of two or more themes
into a single theme. Attributes will be retained
if they have the same name. (polygons, lines,
points)
4
- Clip Clip themes like a cookie cutter on your
input theme. The input theme attributes are not
altered. (polygons, lines, points) - Intersect two themes Cuts an input theme with
the features from an overlay theme to produce an
output theme with features that have attribute
data from both themes. (polygons)
Vector overlay analysis
5
- Union two themes Combines features of an input
theme with the polygone themes from an overlay
theme to produce an output theme that contains
attributes and full extent of both themes.
(polygons) - Identity tool Combines the portions of features
that overlap the identity features to create a
new feature class.
Vector overlay analysis
6
- Update tool Updates the attributes and geometry
of an input feature class or layer by the update
feature class or layer that they overlap.
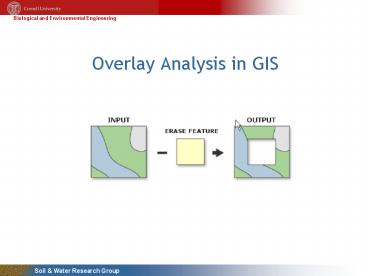
(polygons) - Erase tool Creates a feature class from those
features or portions of features outside the
erase feature class.
Vector overlay analysis
7
- Symmetrical difference tool Creates a feature
class from those features or portions of features
that are not common to any of the other inputs.
(polygons) - Spatial join tool Joins only the attribute data
for features of theme 2 to the features of theme
1, which share the same location.
Vector overlay analysis
8
- Intersect Returns any feature that geometrically
shares a common part with the source feature (or
features).
- Area within a distance of Creates a buffer (or
buffers) with a size equal to the distance
specified around the source feature (or
features), then returns all the features
intersecting the buffer (or buffers).
Select by location spatial query
9
- Completely contain Each point in the geometry
of the source feature must fall inside the
geometry of the target feature, excluding its
boundaries.
- Are completely within Each point in the geometry
of the target feature must fall within the
geometry of the source feature excluding its
boundaries.
Select by location spatial query
10
(No Transcript)
11
Raster overlay
12
- 2. State Plane
- Many states are devided into multiple zones
- Each zone has its own central meridian and
standard parallels - Origin is located in the south of the zone
boundary, false eastings are applied to have
positive x and y values - Boundaries of these zones follow county
boundaries
COORDINATE SYSTEMS
13
- Universal Transverse Mercator (UTM)
- Adopted by the US Army for large scale military
maps - Globe is divided into 60 zones between 84S and
84 N, most of which are 6 wide - Each UTM zone has its central meridian and spans
3 east and west from the center of the zone - The position of the cylinder developable surface
is positioned at a different place around the
globe for each zone
COORDINATE SYSTEMS
- x- and y-coordinates are in meters by convention
of central meridian - y-orgin is the equator
- X-origin is 500,000 m west
14
UTM Zones
15
- Datums
- Sets of parameters and ground control points
defining local coordinate systems - Earth geoid ? geodesists use spheroids or
ellipsoids to model the 3-dimensional shape of
the earth - Still local variations because of the
differential thickness of the earths crust, or
differential gravitation of the crustal material - Datum is created to accountfor these local
variationsin establishing the coordinatesystem - World Geodetic System WGS84
- North American Datum from1927 - NAD27 (fits the
north-american continent better)
DATUMS and SPHEROIDS
16
- Mercator (cylindrical)
- Shape conformal small shapes are well
represented (maintains local angular
relationships) - Area increasingly distorted towards the polar
regions - Direction any straight line drawn on this
projection represents an actual compass bearing - Distance Scale is true along the equator, or
along the secant latitudes
EXAMPLES
17
- Lambert (planar)
- Shape Shape is minimally distorted, less than 2
percent, within 15 from the focal point, angular
distortion is more significant small shapes are
compressed radially from the center and elongated
perpendicularly. - Area equal-area
- Direction True direction radiating from the
central point. - Distance True at center. Scale decreases with
distance from the center along radii and
increases from the center perpendicular to the
radii.
18
- Mollweide
- Shape Shape is not distorted at the intersection
of the central meridian and latitudes 40 44' N
and S. Distortion increases outward from these
points and becomes severe at the edges of the
projection. - Area equal-area
- Direction Local angles are true only at the
intersection of the central meridian and
latitudes 40 44' N and S. Direction is distorted
elsewhere. - Distance Scale is true alonglatitudes 4044' N
and S. Distortion increases with distance from
these lines and becomes severe at the edges of
the projection.
19
- Orthographic
- Shape Minimal distortion near the center
maximal distortion near the edge. - Area The areal scale decreases with distance
from the center. Areal scale is zero at the edge
of the hemisphere. - Direction True direction from the central point.
- Distance The radial scale decreases with
distance from the center and becomeszero on the
edges. The scale perpendicular to the radii,
along the parallels of the polar aspect, is
accurate.
20
- Albers (conic)
- Shape Shape is true along the standard parallels
of the normal aspect (Type 1), or the standard
lines of the transverse and oblique aspects
(Types 2 and 3). Distortion is severe near the
poles of the normal aspect or 90 from the
central line in the transverse and oblique
aspects. - Area There is no area distortion on any of the
projections. - Direction Local angles are correct along
standard parallels or standard lines. Direction
is distorted elsewhere. - Distance Scale is true along the Equator (Type
1), or the standard lines of the transverse and
obliqueaspects (Types 2 and 3). Scale
distortion is severe near the poles of the
normal aspect or 90 from the central linein
the transverse and oblique aspects.
21
(No Transcript)
Recommended
CrystalGraphics Presentations


