
Graphes PowerPoint PPT Presentations
All Time
Recommended

Les Graphes Graphes Un graphe G = (V, E) consiste en un ensemble V de noeud, et un ensemble E d ar tes, tels que chaque ar te dans E relie une paire de n uds ...
| PowerPoint PPT presentation | free to download

Id e : construire un isomorphisme de G1(k) vers un sous-graphe de G2 et essayer d' tendre l'isomorphisme G1(k 1) en ajoutant un n ud inutilis de G2 ...
| PowerPoint PPT presentation | free to view

Graphing software or grapher for science and engineering. Create plots based on mathematical expressions or tabular data with help of graphing program. For more info visit:-https://www.sciexperts.com/by-manufacturer/golden-software/grapher
| PowerPoint PPT presentation | free to download

3-2 Graphs of Linear Equations in 2 Variables Coordinate Plane Standard Form Ax + By = C A,B,C are all integers Any linear equation can be written in this form Linear ...
| PowerPoint PPT presentation | free to view

Graphing a Linear Inequality Graphing a linear inequality is very similar to graphing a linear equation. Graphing a Linear Inequality 1) Solve the inequality for y ...
| PowerPoint PPT presentation | free to download

Title: Basic Elements of a Graph Last modified by: Carrie Dempsey Document presentation format: On-screen Show Company: University of Florida Other titles
| PowerPoint PPT presentation | free to download

Graphing Velocity and Speed Graphing demo What do these graphs ... Title Time (seconds) Displacement ... Graphing Velocity and Speed What do these graphs ...
| PowerPoint PPT presentation | free to download

Other Types of Graphs Pareto Chart Represents a frequency distribution for a categorical variable, frequencies are displayed by the heights of vertical bars, arranged ...
| PowerPoint PPT presentation | free to view

Drawing Velocity Time Graphs from Position Time Graphs Uniform and Non-Uniform Motion How can we use d-t graphs to determine v-t graphs? Find the velocity for each ...
| PowerPoint PPT presentation | free to view
Linear Equations in Two Variables To Graph a Linear Inequality Graph the related linear equality (forms the boundary line) ...
| PowerPoint PPT presentation | free to download

Rules for constructing a graph. Graph paper should always be used ... From a graph you should be able to state a general trend between variables. ...
| PowerPoint PPT presentation | free to view

Bar Graphs Bar graphs are used to show amounts of data. How much? How many? Example the number of students who have a birthday in each month.
| PowerPoint PPT presentation | free to view

First graph the inequality as a dashed line if equality is not included in the original statement, or as a solid line if equality is included. Step 2.
| PowerPoint PPT presentation | free to view

You should be able to state how the graph is related to a 'standard' function. ... verify your answers using a graphing calculator, but only after you have ...
| PowerPoint PPT presentation | free to view
Graphing, Calculating, and Interpreting Rate of Improvement Caitlin S. Flinn, Ed.S., N.C.S.P. Andrew E. McCrea, M.S., N.C.S.P. PaTTAN RtII Institute
| PowerPoint PPT presentation | free to download

Graphing Linear Inequalities using the TI Calculator. 1. Hit Y= 2. Delete all equations. ... Graphing Linear Inequalities using the TI Calculator. Examples ...
| PowerPoint PPT presentation | free to view

Enter the equations in y= on the graphing calculator. Make sure your plot is OFF. ... Sometimes you don't have a graphing calculator to use. ...
| PowerPoint PPT presentation | free to view

2) graphing calculators. 3) Maple 7 and Excel (computer programs) Teaching Sequence: ... THE LAB IS AVAILABLE ONLINE, SO THE STUDENTS CAN GET EXTRA COPIES AT ...
| PowerPoint PPT presentation | free to view

According to study, over the next 5 years the Online Graphing Calculators market will register a xx% CAGR in terms of revenue, the global market size will reach xx Million USD by 2026, from xx Million USD in 2020
| PowerPoint PPT presentation | free to download

The progressing development of analytics in the world are creating a high-end technological environment. In which Graph analytics is seeking more of the attention from the users. Generally, graph analytics is mainly used to determine the strength and direction of relationships between the objects in a graph. Graph Analytics usually comprises of a graph structure which assists in understanding, coding and visualizing the relationships that exist between people or devices in a network.
| PowerPoint PPT presentation | free to download

Graph Analytics Market is projected to grow at a CAGR of 33.7% during the forecasting period 2021-2027. Graph analytics aids in clustering of information, searching the depth, knowing the shortest and largest part, ranking the page and many such benefits.
| PowerPoint PPT presentation | free to download

Graphing an ordered pair requires the use of graph paper and the use of two ... The four regions of the graph are called quadrants. ...
| PowerPoint PPT presentation | free to view
Rapid digitization has resulted in the production of large volumes of unstructured data. This trend is expected to provide significant opportunities for graph database market in the upcoming years
| PowerPoint PPT presentation | free to download

Title: Line Graphs Author: rrussell Last modified by: rrussell Created Date: 10/22/2004 3:01:03 AM Document presentation format: On-screen Show Company
| PowerPoint PPT presentation | free to download

Graph: y = x + 2 5 4 3 2 1 5 4 3 2 1 1 2 5 4 3 1 2 3 4 5
| PowerPoint PPT presentation | free to view

Tips for putting bar graphs into s
| PowerPoint PPT presentation | free to view

Graph analytics market is expected to reach USD 5,741.82 million by 2027
| PowerPoint PPT presentation | free to download

Title: Graph Theory Last modified by: Document presentation format: (4:3) Other titles: Arial Lucida Sans Unicode ...
| PowerPoint PPT presentation | free to download

Types of Knowledge Graph Snippets
| PowerPoint PPT presentation | free to download

Computing Fundamentals 2 Lecture 1 A Theory of Graphs Lecturer: Patrick Browne Room [KA] - 3-020, Lab [KA] - 1-017 Based on Chapter 19. A Logical approach to Discrete ...
| PowerPoint PPT presentation | free to view

3.2 The Graph of a Function Goals: Identify the Graph of a function Read the graph of a function Obtain info from the Graph of a Function Discussion of example ...
| PowerPoint PPT presentation | free to download

On k-Edge-magic Cubic Graphs Sin-Min Lee, San Jose State University Hsin-hao Su*, Stonehill College Yung-Chin Wang, Tzu-Hui Institute of Technology
| PowerPoint PPT presentation | free to download
Dynamic Graph Transformation Systems Hern n Melgratti IMT Lucca Institute for Advance Studies Joint Work with Roberto Bruni Dipartimento di Informatica, Universit ...
| PowerPoint PPT presentation | free to download

Research on Graph-Cut for Stereo Vision Presenter: Nelson Chang Institute of Electronics, National Chiao Tung University
| PowerPoint PPT presentation | free to view

New Graph Bipartizations for Double-Exposure, Bright Field Alternating Phase-Shift Mask Layout Andrew B. Kahng (UCSD) abk@ucsd.edu Shailesh Vaya (UCLA)
| PowerPoint PPT presentation | free to download

Motion Graphs Lecture 3 Video14. Bill Nye: Motion Motion & Graphs Motion graphs are an important tool used to show the relationships between position, speed, and time.
| PowerPoint PPT presentation | free to download

Position-Time Graphs Vectors & Scalars Distance vs. Displacement Summary of Concepts Distance is the length of the path traveled. Distance is a scalar quanity ...
| PowerPoint PPT presentation | free to view

Interactive Graph Cuts for Segmentation in N-D Images Yuri Boykov, Marie-Piere Jolly Mohit Gupta 02/15/2006 Advanced Perception
| PowerPoint PPT presentation | free to download
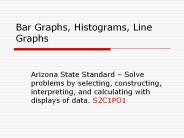
Bar Graphs, Histograms, Line Graphs Arizona State Standard Solve problems by selecting, constructing, interpreting, and calculating with displays of data.
| PowerPoint PPT presentation | free to download
Detecting Communities Via Simultaneous Clustering of Graphs and Folksonomies Akshay Java Anupam Joshi Tim Finin University of Maryland, Baltimore County
| PowerPoint PPT presentation | free to download

Graph Theory: Introduction Pallab Dasgupta, Professor, Dept. of Computer Sc. and Engineering, IIT Kharagpur pallab@cse.iitkgp.ernet.in
| PowerPoint PPT presentation | free to view

Objective - To graph exponential functions. Graph It is a Function! Objective - To graph exponential functions. Objective - To graph exponential functions.
| PowerPoint PPT presentation | free to view

Venn Diagram large Graphs Look similar to a Venn Diagram: Where some communities will share nodes Like the picture below. This is an example of what an LFR graph ...
| PowerPoint PPT presentation | free to download
Graphs I Kruse and Ryba Chapter 12
| PowerPoint PPT presentation | free to download
Chapter 1, Section 3: Communicating with Graphs (C.P. Exploring Science) GRAPHS A visual display of information or data Why use graphs? They show patterns in data ...
| PowerPoint PPT presentation | free to download

Global graph database market is expected register a 24.2% CAGR in the forecast period of 2019-2026. Growing adoption and need in identifying the complex patterns along with the rapid use of virtualization for Big Data analytics are expected grow global graph database market
| PowerPoint PPT presentation | free to download
3-1: Solving Linear Systems by Graphing (Day 1) Objective: CA 2.6: Students solve systems of linear equations and inequalities (in two or three variables) by ...
| PowerPoint PPT presentation | free to download

Graph Transformations (I) f(x) , f(x) +/- k ... (4,2) (1,-1) (12,2) (4,2) (3,-1) (1,-1) Trig Graphs The same transformation rules apply to the basic trig graphs ...
| PowerPoint PPT presentation | free to view

0606.3.9 Graph ordered pairs of integers in all four quadrants of the Cartesian coordinate system. I CAN graph ordered pairs in ALL four quadrants!!!
| PowerPoint PPT presentation | free to view

Directed Graphs Chapter 8 *
| PowerPoint PPT presentation | free to view

Based on lectures by James Demmel ... Graph Partitioning Laura Grigori and James Demmel www.cs.berkeley.edu/~demmel/cs267_Spr15
| PowerPoint PPT presentation | free to download
7.5 Graphing Square Root & Cube Root Functions Objectives/Assignment Graph square root and cube root functions Assignment: 15-49 odd First, let s look at the graphs.
| PowerPoint PPT presentation | free to download

Transforming the Logarithm Graph Logarithmic Function Transforming the Logarithm Graph Logarithmic Function Parent Equation Graphing Form Example: Exponential y = 2 x ...
| PowerPoint PPT presentation | free to download

Chapter 3 Functions and Graphs A _____ is a correspondence between two quantities. e.g. Students heights and their corresponding weight.
| PowerPoint PPT presentation | free to view
Title: Graphing Linear Functions Author: Skip Tyler Last modified by: dwesley Created Date: 6/19/2001 2:03:32 AM Document presentation format: On-screen Show
| PowerPoint PPT presentation | free to download

Elements of a Graph Insanity of Statements Why use a graph? Graphs are very useful tools in science: A graph is used by scientist to organize the facts so they can be ...
| PowerPoint PPT presentation | free to view