
Deviation PowerPoint PPT Presentations
All Time
Recommended

For burets, pipets, volumetric flasks, etc., use ... Volumetric Pipet. Uncertainty of a SINGLE MEASUREMENT. Check the ... of buret and pipet: Fill with de ...
| PowerPoint PPT presentation | free to download

For burets, pipets, volumetric flasks, etc., use ... Volumetric Pipet. Uncertainty of a SINGLE MEASUREMENT. Check the ... of buret and pipet: Fill with de ...
| PowerPoint PPT presentation | free to download

... Students should be allowed to report controversial issues in their student newspapers without ... The sampling distribution ... Are women still paid less ...
| PowerPoint PPT presentation | free to download
Enrolling in Six Sigma training is a wise investment in your career advancement and the success of your company.
| PowerPoint PPT presentation | free to download

Title: Standard Deviation Author: Stoney Pryor Last modified by: Knight, Wendy Created Date: 8/23/2005 3:00:42 AM Document presentation format: On-screen Show (4:3)
| PowerPoint PPT presentation | free to view


Z = (120 -100)/16 = 1.25 Find P(Z 1.25) from standard normal chart or your TI calculator. Answer: ... With the TI 83/84: a = invNorm( .02, 100 , 15) ...
| PowerPoint PPT presentation | free to view

The formula used to calculate the STANDARD DEVIATION of. a SET OF NUMBERS is: ... Midpoint (x) Frequency (f) Age (years) Standard Deviation For a Grouped ...
| PowerPoint PPT presentation | free to download

Calculate Standard Deviation https://www.easycalculation.com/statistics/standard-deviation.php Online calculator to find the mean, variance and standard deviation from a set of given data.
| PowerPoint PPT presentation | free to download

Axis Deviation Chapter 5 Definition Electrical axis... The general direction in the frontal plane or toward which lead the QRS complex is predominately oriented ...
| PowerPoint PPT presentation | free to download

Standard Deviation A measure of variability Commonly used to calculate other statistical measures Shows the distance (difference) between the mean and the steepest ...
| PowerPoint PPT presentation | free to view

Top Benefits For Using Online Standard Deviation Calculator
| PowerPoint PPT presentation | free to download

Deviations from HWE I. Mutation II. Migration III. Non-Random Mating IV. Genetic Drift V. The Neutral Theory
| PowerPoint PPT presentation | free to download

... a survey to see how many books were carried to school by 10 pupils. the data obtained gave the results x ... 7 finalists gave the following time (seconds) data ...
| PowerPoint PPT presentation | free to view

change spec/procedure) Deviation Sent to. TG for. Resolution (Industry Level change) ... To ensure there is an internal temporary deviation process/procedure ...
| PowerPoint PPT presentation | free to view

Prosthetic Gait Deviations Karyn Duff Prosthetist / Orthotist Hunter Prosthetics and Orthotics Service What is a gait deviation? Any gait characteristic that differs ...
| PowerPoint PPT presentation | free to download

... is simply the square root of the variance. Your TI-83 calls this Sx. ... The number n-1 is called the degrees of freedom of the variance or standard deviation. ...
| PowerPoint PPT presentation | free to view

Requirement Deviation, OOS and reporting Investigation RCA Investigative tools: Why –Why , Cause & Effect and FTA Human error CAPA Implementation Investigation report Verification for effectiveness
| PowerPoint PPT presentation | free to download

... can be measured in different units (feet vs meters, pounds vs kilograms, etc) When converting units, the measures of center and spread will change. ...
| PowerPoint PPT presentation | free to view

Norm: why language is normative. Standard: why nations adopt standard ... only full members of the club know the norms properly. so outsiders are easy to spot ...
| PowerPoint PPT presentation | free to view
Learn how to calculate standard deviation.
| PowerPoint PPT presentation | free to download

News Report Call to Action. Click Space Above for Video. ICAO Definition: Runway Incursion 'Any occurrence at an aerodrome involving the incorrect presence of ...
| PowerPoint PPT presentation | free to view

Deviation from ideal mental health Deviation from ideal mental health This definition gives the normal characteristics i.e. those of mental health rather than ...
| PowerPoint PPT presentation | free to view

The Population Mean and Standard Deviation X *
| PowerPoint PPT presentation | free to view

Find the mean, variance, standard deviation of the given numbers at Easycalculation.com
| PowerPoint PPT presentation | free to download

dense spike (might expect this since spike internodes also would be shortened) ... Thankfully these gene-trait relationships are RARE. Deviations from Mendelian Ratios ...
| PowerPoint PPT presentation | free to view

SAMPLE SHIP'S DEVIATION TABLE Select the Deviation for the NEAREST tabulated entry for the Heading. For greater accuracy, you may interpolate. USE WHEN CONVERTING TO ...
| PowerPoint PPT presentation | free to download

Title: CFI Workshop Module 8, Core Topic 15 Subject: Pilot Deviaitons Including Runway Incursions Author: Jim Leavitt Last modified by: Dennis Whitley
| PowerPoint PPT presentation | free to download

Observation deviation of the facial & anterior tooth midline I. Statement of Problem anterior tooth midline facial midline ...
| PowerPoint PPT presentation | free to view

We are using the SD as a relative or comparative measure ... The statement that a measurement falls within the interval or the interval is ...
| PowerPoint PPT presentation | free to view

How to diagnose and recognize vertical deviations Part III Brown Syndrome G. Vike Vicente, MD Eye Doctors of Washington Brown Syndrome Aka oblique tendon sheath ...
| PowerPoint PPT presentation | free to download

... table in the next shows the marks for pupils who sat ... a boxplot to represent each set of data. 9. 8. 10. 16. 10. 12. 8. 14. 7. 11. 10. 20. 9. 13. 7. 19 ...
| PowerPoint PPT presentation | free to view
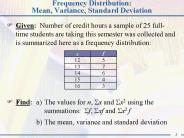
Frequency Distribution: Mean, Variance, Standard Deviation Given: Number of credit hours a sample of 25 full-time students are taking this semester was collected and ...
| PowerPoint PPT presentation | free to download

Chapter 3: Deviations from the Hardy-Weinberg equilibrium Systematic deviations Selection, migration and mutation Random genetic drift Small effective population size
| PowerPoint PPT presentation | free to download

Sample vs Population comparing mean and standard deviations MM2D1d Compare the means and standard deviations of random samples with the corresponding population ...
| PowerPoint PPT presentation | free to download

Title: No Slide Title Author: Graham Hole Last modified by: grahamh Created Date: 3/22/2001 9:24:22 AM Document presentation format: On-screen Show
| PowerPoint PPT presentation | free to download

Discern the requisite number of occasions and reliability of the original test ... ISDs from few occasions lack statistical power. ...
| PowerPoint PPT presentation | free to view

Title: Using Standard Deviation Data in Operational Forecasting Author: mjbodner Last modified by: mjbodner Created Date: 9/14/2004 6:01:25 PM Document presentation ...
| PowerPoint PPT presentation | free to view

... in terms of flight deviations and delays are regularly occurring in the NAS? ... Departure Delays for July 12th July 18th 1999, by Arrival Airport, Scheduled ...
| PowerPoint PPT presentation | free to view

Directional Drilling: deviation from drilling a straight hole. Drilled straight to a predetermined depth, and then gradually curved. Typical curvature: 2-3 degrees ...
| PowerPoint PPT presentation | free to download

How can we describe the uncertainties of source spectrum estimation when using ... In theory, far-field seismometer will record displacement pulse from small ...
| PowerPoint PPT presentation | free to view

Probability & Statistics The Variance and Standard Deviation The Most Important Number In the last section we looked at three related concepts: The mean of a sample ...
| PowerPoint PPT presentation | free to view

Unit 4 Measures of Central Tendency, Dispersion, IQR and standard deviation Day 93 * How do we describe data using statistical measures?
| PowerPoint PPT presentation | free to download

7.5 Hypothesis Testing for Variance and Standard Deviation Key Concepts: The Chi-Square Distribution Critical Values and Rejection Regions Chi-Square Test for 2 and
| PowerPoint PPT presentation | free to download

Title: Introduction to Decision Analysis Subject: Decision Analysis Author: Michael Monticino Description: Course to Denton Utilities Last modified by
| PowerPoint PPT presentation | free to download

Chapter 6 The Standard Deviation as a Ruler and the Normal Model
| PowerPoint PPT presentation | free to view
Anthrax release occurred at a random point during the second year ... Detection time calculated as first alert after anthrax release. ...
| PowerPoint PPT presentation | free to download

The briefing content should include both normal and non-normal ... Cognitive & teamworking skills. Content at appropriate level of detail. Operational context ...
| PowerPoint PPT presentation | free to download

If the misalignment is worse on left head tilt then the patient will walk into ... How can you differentiate this from a neck torticollis? ...
| PowerPoint PPT presentation | free to download

QRB 501 Week 4 Learning Team Standard Deviation Abstract
| PowerPoint PPT presentation | free to download

Click felt on trochlea in some acquired cases. Often seen with chin up position ... Down shoot in attempted elevation in adduction? In honor of Valentine's day ...
| PowerPoint PPT presentation | free to download

Dominican Republic Budget Deviation, 1996-2000 ... Source: Dominican Republic PER 2003, background data. Application. The World Bank ...
| PowerPoint PPT presentation | free to download

Set-points for Subjective Wellbeing: real or imagined? Robert A. Cummins Australian Centre on Quality of Life Deakin University http://www.deakin.edu.au/research/acqol
| PowerPoint PPT presentation | free to download

FOR MORE CLASSES VISIT www.tutorialoutlet.com The Survey of Study Habits and Attitudes (SSHA) is a psychological test that measures the motivation, attitudes, and study habits of college students. Scores range from 0 to 200 and follow (approximately) a Normal distribution, with mean of 115 and standard deviation 25. A researcher suspects that incoming freshmen have a mean μ, which is different from 115, because they are often excited yet anxious about entering college. To verify her suspicion, she tests the hypotheses H0: μ = 115
| PowerPoint PPT presentation | free to download

Page 31 of your Statistics 1 book and try ... E3. The right ... 70 girls tested. You can still estimate the median and inter-quartile ranges. 90 boys tested ...
| PowerPoint PPT presentation | free to view

... percent of men are taller than 74 inches? P(Y 74) = 1-P(Y 74) ... What percent of men are between 68 and 71 inches tall? P(68 Y 71) = P(Y 71) P(Y 68) ...
| PowerPoint PPT presentation | free to view